Loading . . .

REPORT SECTIONS:    Intro    Predict     Align     Psychographics     Community     Recommendations     Ahead    

Next - Psychographic Market Segmentation Analysis

Utilizing our predictive maps, PAP partnered with Acxiom, a consumer data expert, to help identify the dominant market segments in Little Rock by risk location.

The psychographic characteristics of these market segments will be utilized for:

  • Optimizing community engagement
  • Developing targeted prevention messaging
  • Resource and infrastructure allocation
  • Marketing of prevention opportunities

THE ANALYTIC APPROACH FOR LITTLE ROCK’S PSYCHOGRAPHIC MARKET SEGMENTATION

1 PREDICT-ALIGN-PREVENT PROVIDED SHAPE FILES OF THE LITTLE ROCK AREA WITH DESIGNATED GEO BOUNDARIES MEASURING 500 SQUARE FEET

2 APPENDED FILE WITH INFOBASE® + PERSONICX® + AUDIENCE PROPENSITIES® MODELS SELECTED TO SUPPORT PAP PROGRAM METHODOLOGY

3 PREDICT-ALIGN-PREVENT’S PRIOR ANALYSIS ASSIGNED CHILD MALTREATMENT RISK CATEGORIES (1=LOWEST RISK, 5=HIGHEST RISK)

4 FOR EACH CELL, DEMOGRAPHICS, LIFESTYLE, AND COMMUNICATION PREFERENCES HAVE BEEN DETERMINED TO HELP DELIVER THE PROGRAM’S INTENDED OUTCOMES

5 THE RESULTS CAN BE USED TO INFORM A CAMPAIGN MESSAGING STRATEGY FOCUSED ON THE PREVENTION OF CHILD MALTREATMENT

THE FOLLOWING ARE HIGHLIGHTS OF LITTLE ROCK’S PSYCHOGRAPHIC CHARACTERISTICS

PORTRAIT OF A HIGH RISK HOUSEHOLD

DEMOGRAPHICS

LIFESTYLE AND INTERESTS

SELF CARE

MEDIA PREFERENCES OF HIGH-RISK HOUSEHOLDS IN LITTLE ROCK

HIGH RISK HOUSEHOLDS ARE HEAVY TV USERS WHO TRUST TV MEDIA FOR INFORMATION AND INSPIRATION

THEY ENJOY A VARIETY OF SHOWS INCLUDING:

  • Reality Television
  • Music videos
  • Game shows
  • Talk shows
  • Soap operas
  • Religious shows
  • Wrestling

THEY ARE RADIO LISTENERS WHO ENJOY GOSPEL AND URBAN MUSIC AND REGULARLY USE PANDORA

THESE HOUSEHOLDS INCLUDE ACTIVE SOCIAL MEDIA USERS AND ARE LIKELY TO HAVE FACEBOOK, INSTAGRAM, AND TWITTER ACCOUNTS

LET'S TAKE A LOOK

AT ACXIOM'S PERSONICX® PERSPECTIVES FOR LITTLE ROCK RISK CATEGORIES

THE TOP TEN PERSONICX LIFESTAGE CLUSTERS MOST APPLICABLE TO PEOPLE LIVING IN RISK CATEGORY 5 VS RISK 1, 2, 3, REPRESENT 42.96% OF THIS GROUP

TOP 10 PERSONICX LIFESTAGE CLUSTERS LIVING IN RISK CATEGORY 5 VS RISK 1, 2, AND 3
Characteristic Percent Z-Score Index
67 - First Steps 4.59% 57.2 578
62 - Movies & Sports 4.85% 51.1 477
63 - Staying Home 6.20% 51.1 408
59 - Mobile Mixers 5.56% 47.9 403
53 - Metro Strivers 7.51% 47.8 337
39 - Setting Goals 2.88% 42.7 534
69 - Productive Havens 1.66% 35.7 613
70 - Favorably Frugal 2.66% 33.9 417
57 - Collegiate Crowd 4.48% 30.7 281
65 - Hobbies & Shopping 2.57% 26.6 322
• DEFINITIONS

Insights on the top three clusters

WHEN WE INCLUDE RISK CATEGORY 4 AND COMPARE 4 & 5 VS RISK CATEGORIES 1, 2, 3, WE SEE THE TOP TEN LIFESTAGE CLUSTERS COMPRISE 34.02 % OF THE GROUP REPRESENTED

TOP 10 PERSONICX LIFESTAGE CLUSTERS LIVING IN RISK CATEGORY 4 & 5 VS RISK 1, 2, AND 3
Characteristic Percent Z-Score Index
67 - First Steps 3.44% 46.9 432
53 - Metro Strivers 6.51% 45.7 292
63 - Staying Home 4.87% 43.1 320
62 - Movies & Sports 3.66% 41.5 360
59 - Mobile Mixers 4.14% 37.2 299
39 - Setting Goals 2.25% 36.8 417
69 - Productive Havens 1.38% 33.7 511
57 - Collegiate Crowd 3.68% 26.2 230
70 - Favorably Frugal 1.89% 24.8 296
65 - Hobbies & Shopping 2.20% 24.7 275
• DEFINITIONS

WHILE THE FIRST AND LAST CLUSTER REMAINS THE SAME, THE SECOND CLUSTER HAS CHANGED

Key Insights

of our Psychographic Segmentation

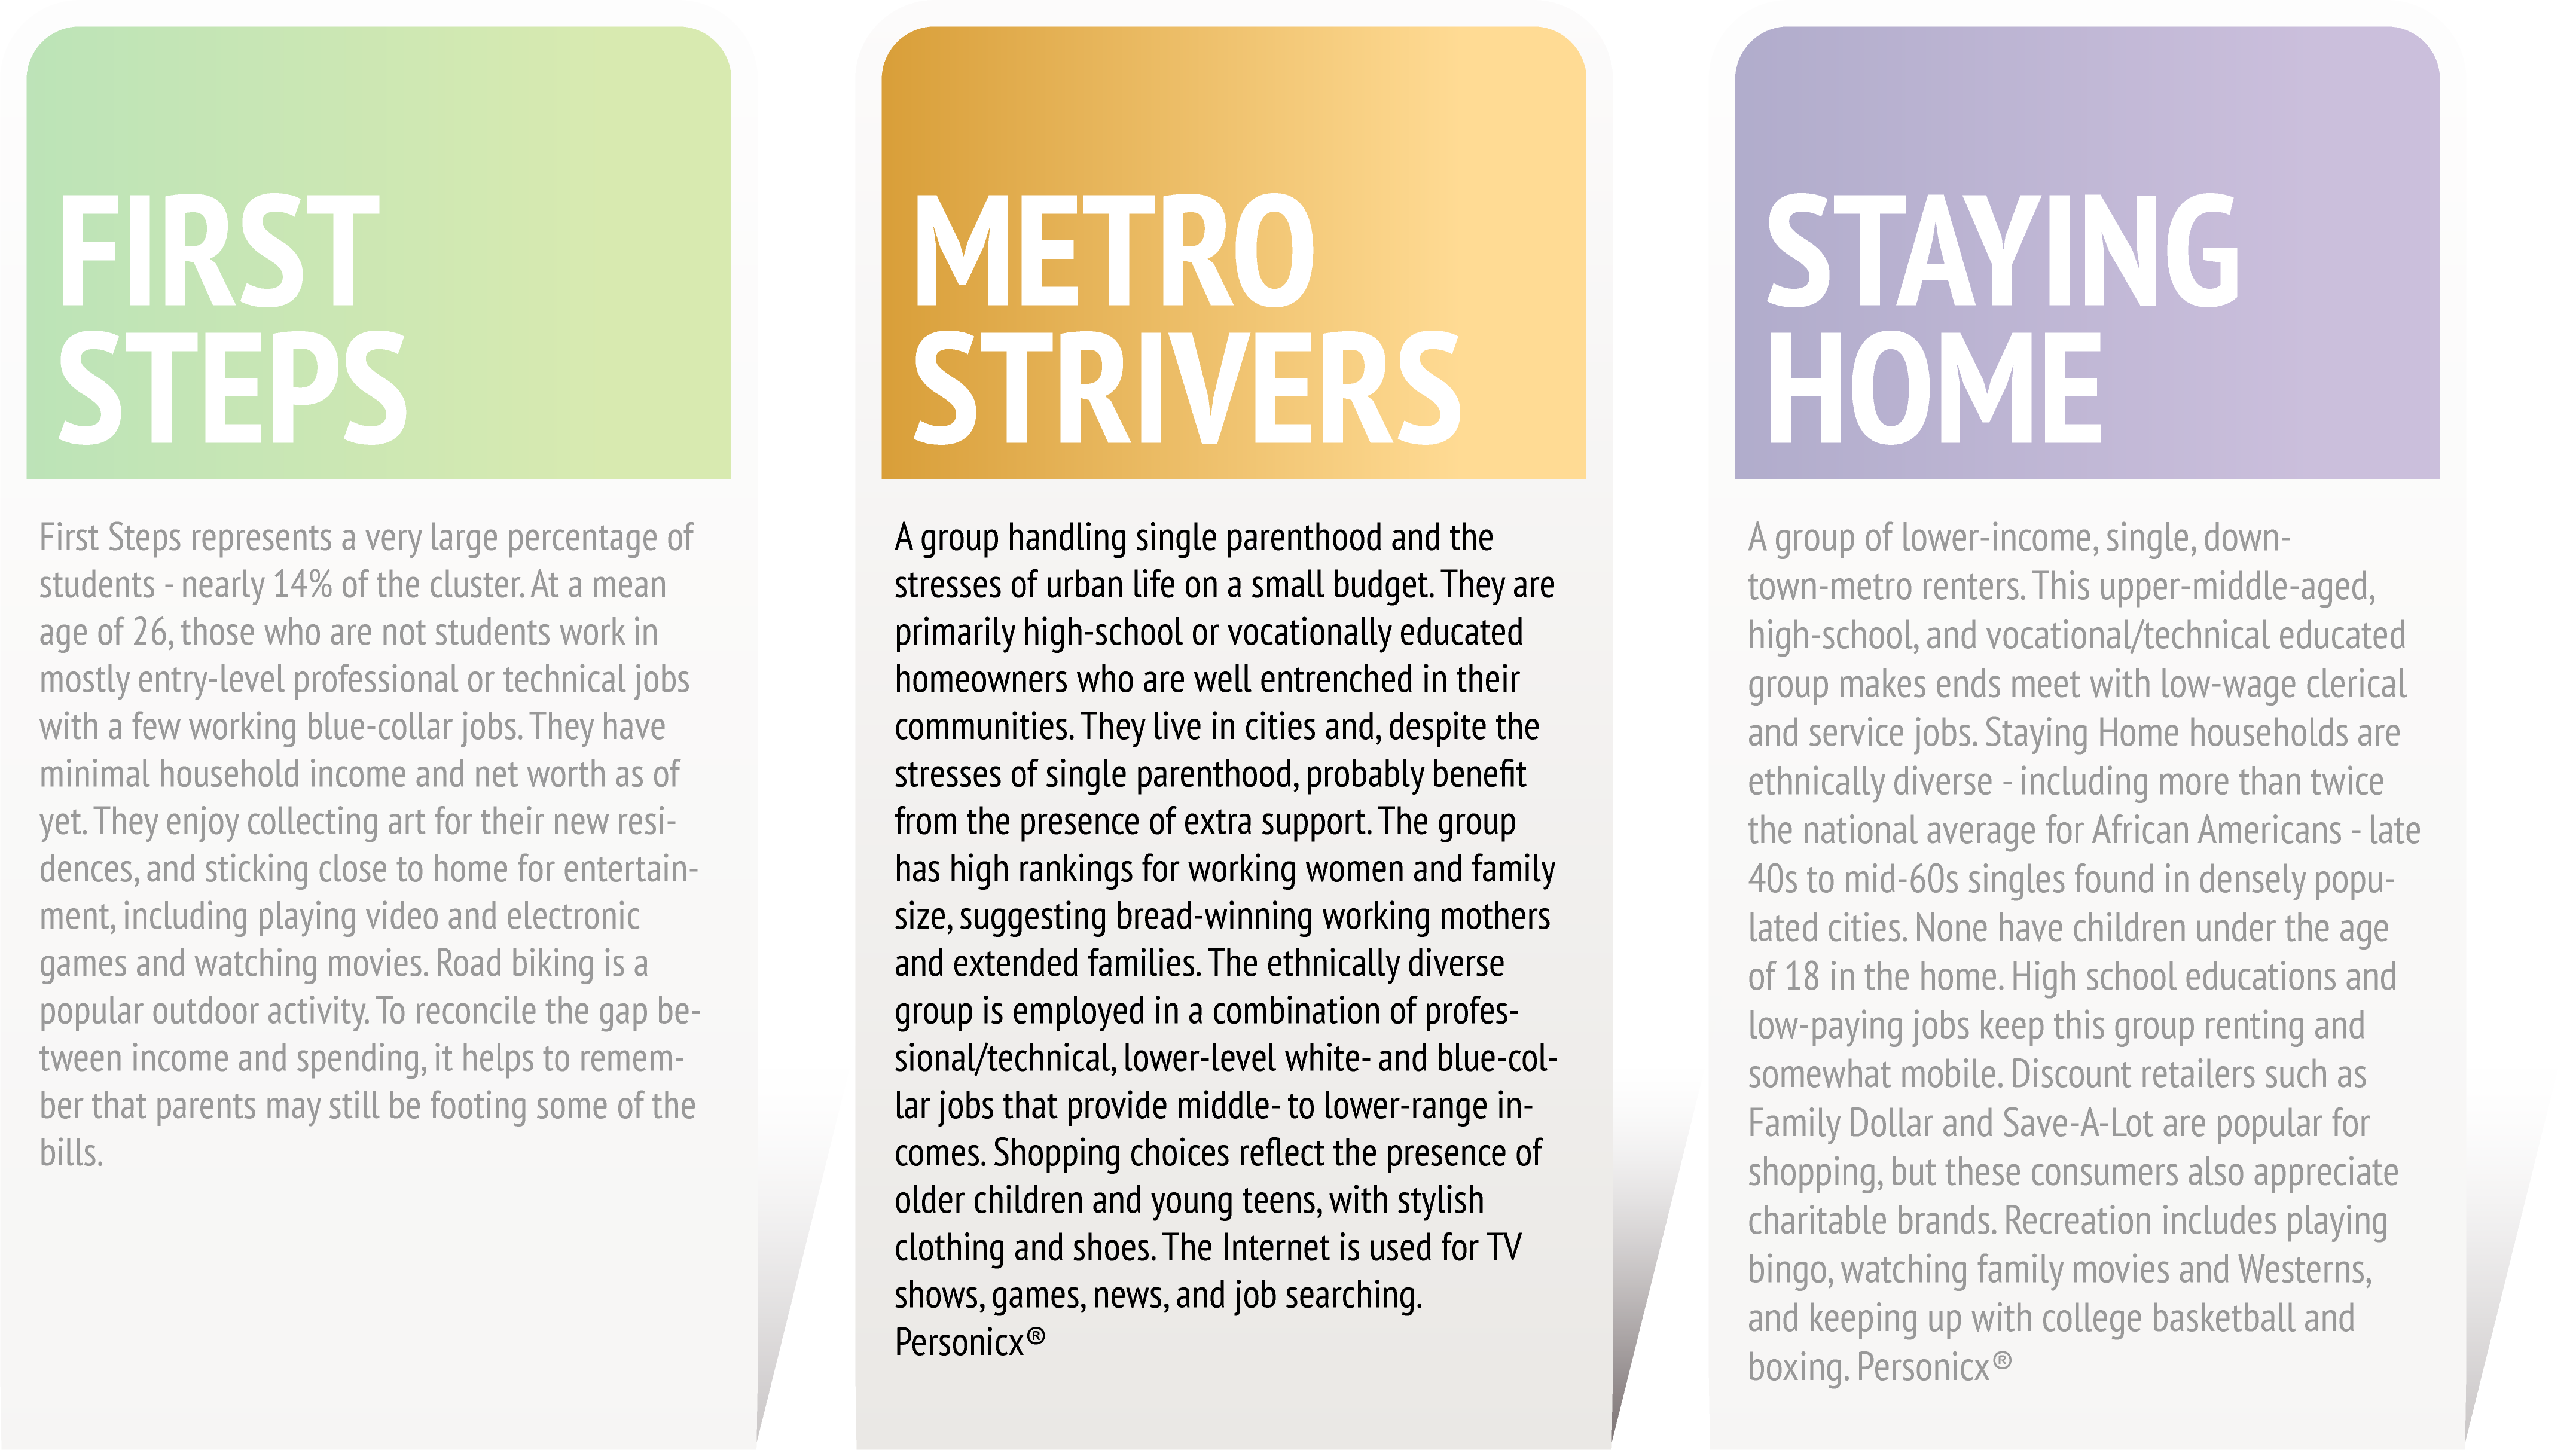
At this level of granularity, the psychographic segmentation data is more reliable than census data and challenges assumptions that are commonly made with the use of census data alone

The relationship of poverty to spatial child maltreatment risk was evaluated in two ways, first via census poverty data extrapolated from the census block to the grid cell, and second, using psychographic data to define population demographics by grid cell.

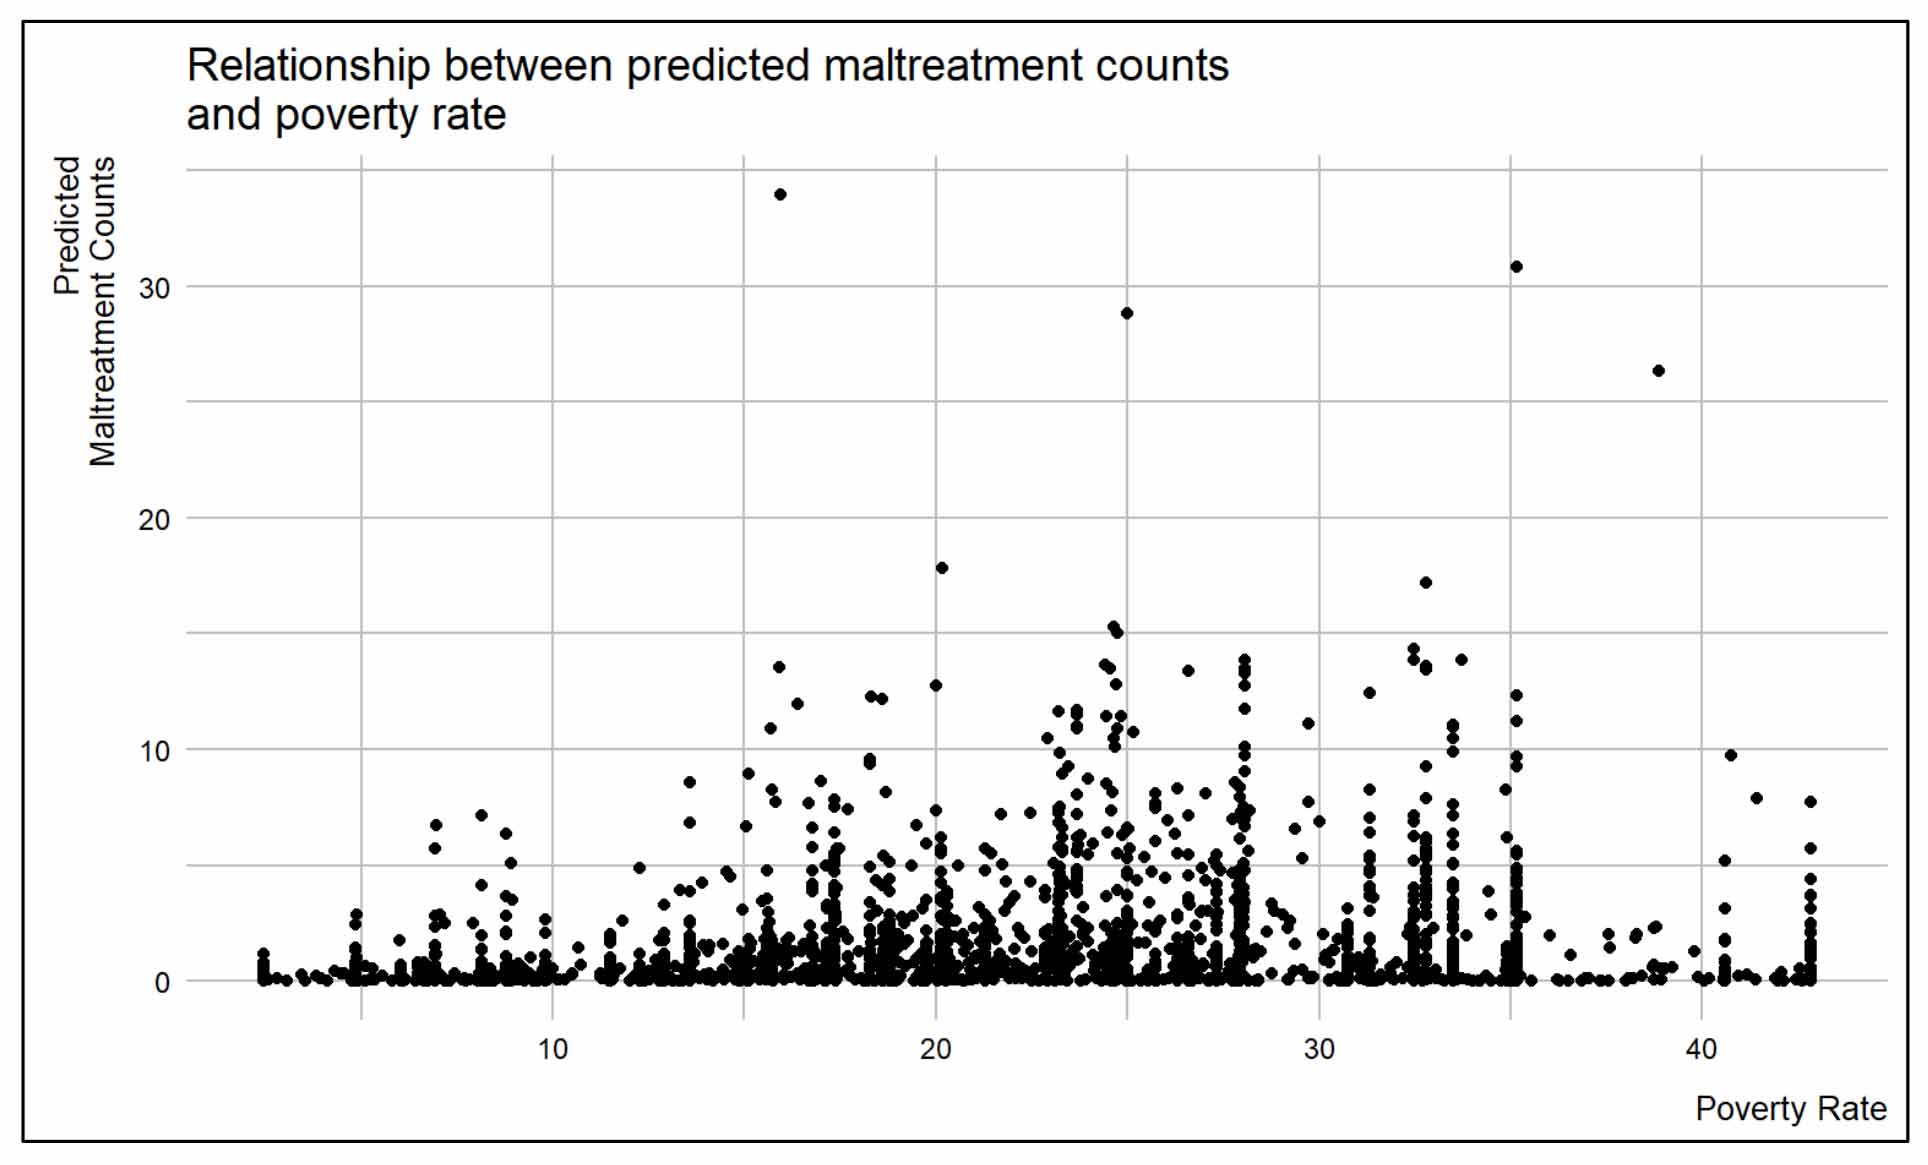
Using census data, there was a weak correlation between child maltreatment risk and poverty.

The figure below illustrates the relationship between poverty rate and predicted maltreatment count. The scatter plot demonstrates that the correlation between poverty and predictive risk is marginal.

With psychographic data, the main differentiator for the highest risk category was extreme poverty.

These findings suggest that at a unit of analysis smaller than a census block, census derived poverty data does not accurately describe the relationship of poverty to spatial child maltreatment risk.

To improve spatial targeting of scarce prevention resources and basic needs supports, further research is indicated to identify the most accurate data sources at a unit of analysis smaller than a census block.

Our analysis provides insight into family dynamics impacting child maltreatment

Risk category 5 over indexes on single mothers living in severe poverty with less than average interest in parenting. The hypothesis is that child fatality occurring in those areas are more likely to be attributable to neglectful supervision.

On the other hand, in risk category 4 where a male adult is more likely to be present in the household, the hypothesis is that more fatalities will be due to violence. If this is the case, the strategy for prevention would need to be approached differently for each location.

Psychographic segmentation data highlights what types of media high-risk households in Little Rock are consuming

It appears that current Little Rock prevention campaigns are not aligned to the correct media channels for achieving the greatest impact or reach.

Click to Continue to Community Section

References

  • Daley D., Bachmann M., Bachmann B.A., Pedigo C., Bui. M.T., & Coffman J. (2016). Risk terrain modeling predicts child maltreatment. Child Abuse Neglect. 62:29-38. doi:10.1016/j.chiabu.2016.09.014. https://www.sciencedirect.com/science/article/pii/S0145213416301922
  • Predict Align Prevent (2019). Richmond, Virginia Technical Report. https://b9157c41-5fbe-4e28-8784-ea36ffdbce2f.filesusr.com/ugd/fbb580_2f1dda2ff6b84f32856bc95d802d6629.pdf
Visit www.Predict-Align-Prevent.org

Contents Copyright © 2021 Predict-Align-Prevent and respective rightsholders. Some rights reserved.