Information regarding community voice, the spatial allocation of prevention resources and protective assets, prevention coalitions, and population psychographics are gathered in collaboration with community partners for the purpose of developing and executing a data-driven strategic plan for prevention.
Little Rock's Align Phase
A community working together to keep its children safe
Our findings from the Predict phase are now used to evaluate the extent to which the supply of child welfare services are properly aligned with the demand for these services. We have developed several analytics to help us understand this.
First, we look at the population totals in each risk category to understand the number of people living in high-risk areas. We also explore the relationship further between poverty and child maltreatment risk.
To understand what services are optimally located, we look at the distribution of protective resources across the five risk categories, as well as calculate the mean predicted count of maltreatment events within a quarter-mile of each protective resource. This gives us insight into whether these are optimal locations to deploy resources at.
Lastly, we perform a gap analysis that illustrates whether the supply and demand of child welfare services are aligned.
Let’s start with an overview
spatial allocation of prevention resources and protective assets
The demand for child welfare services is related to the number of people living in high risk areas. The figure below shows that approximately 33,210 people live in the highest risk category, covering 15.8% of the total population in Little Rock. Another 28.1% of the population (59,221) reside in the second highest risk category, indicating, in total, over 44% of the population live in areas of potentially high demand for child welfare services.

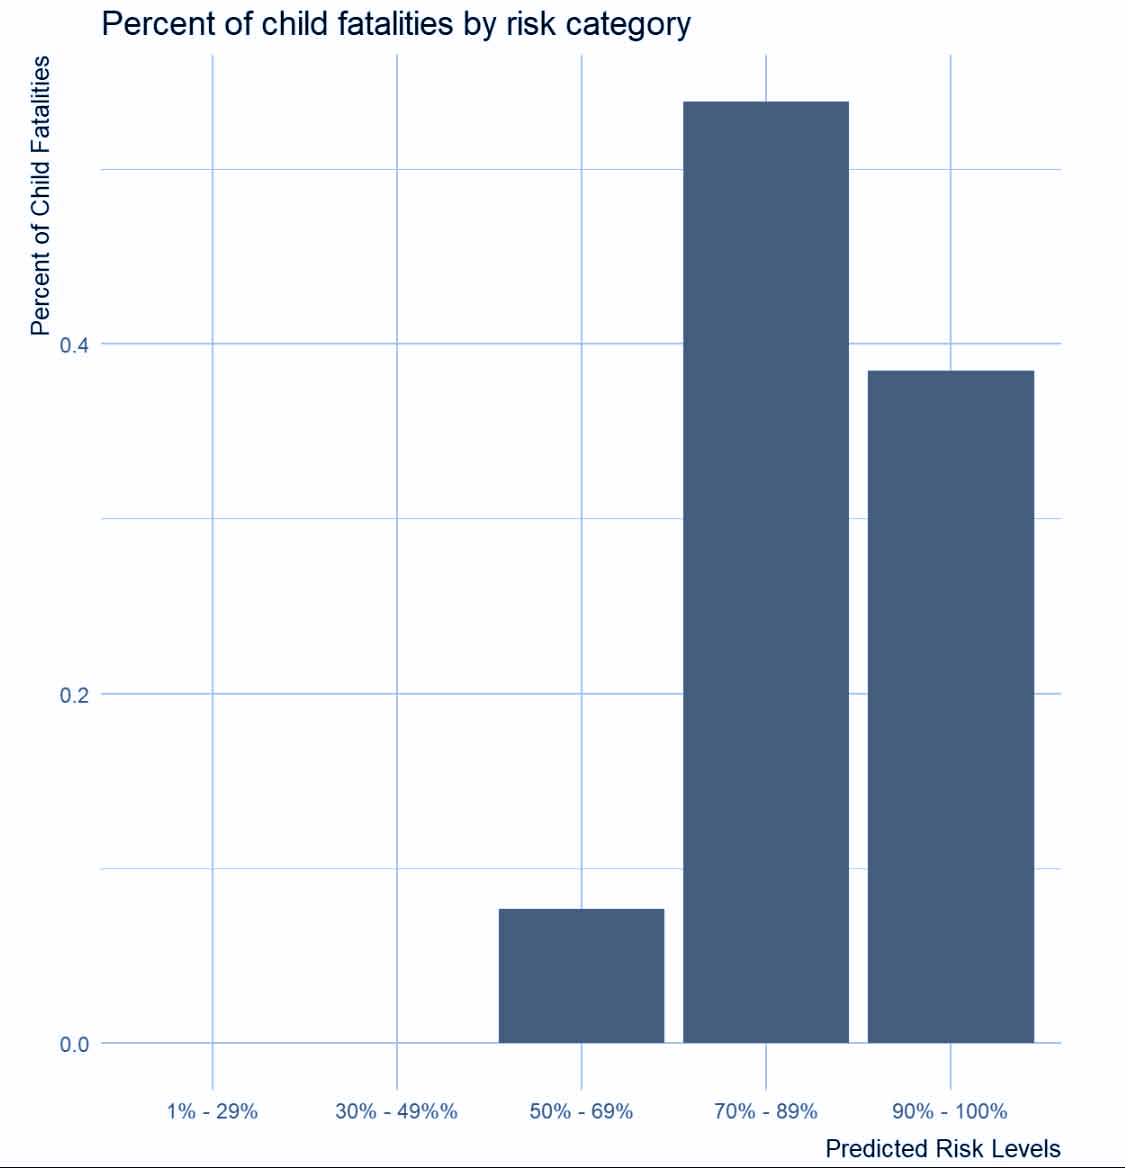
Maltreatment Risk and Child Fatalities
The bar plot below shows most child fatalities are occurring in the highest risk categories
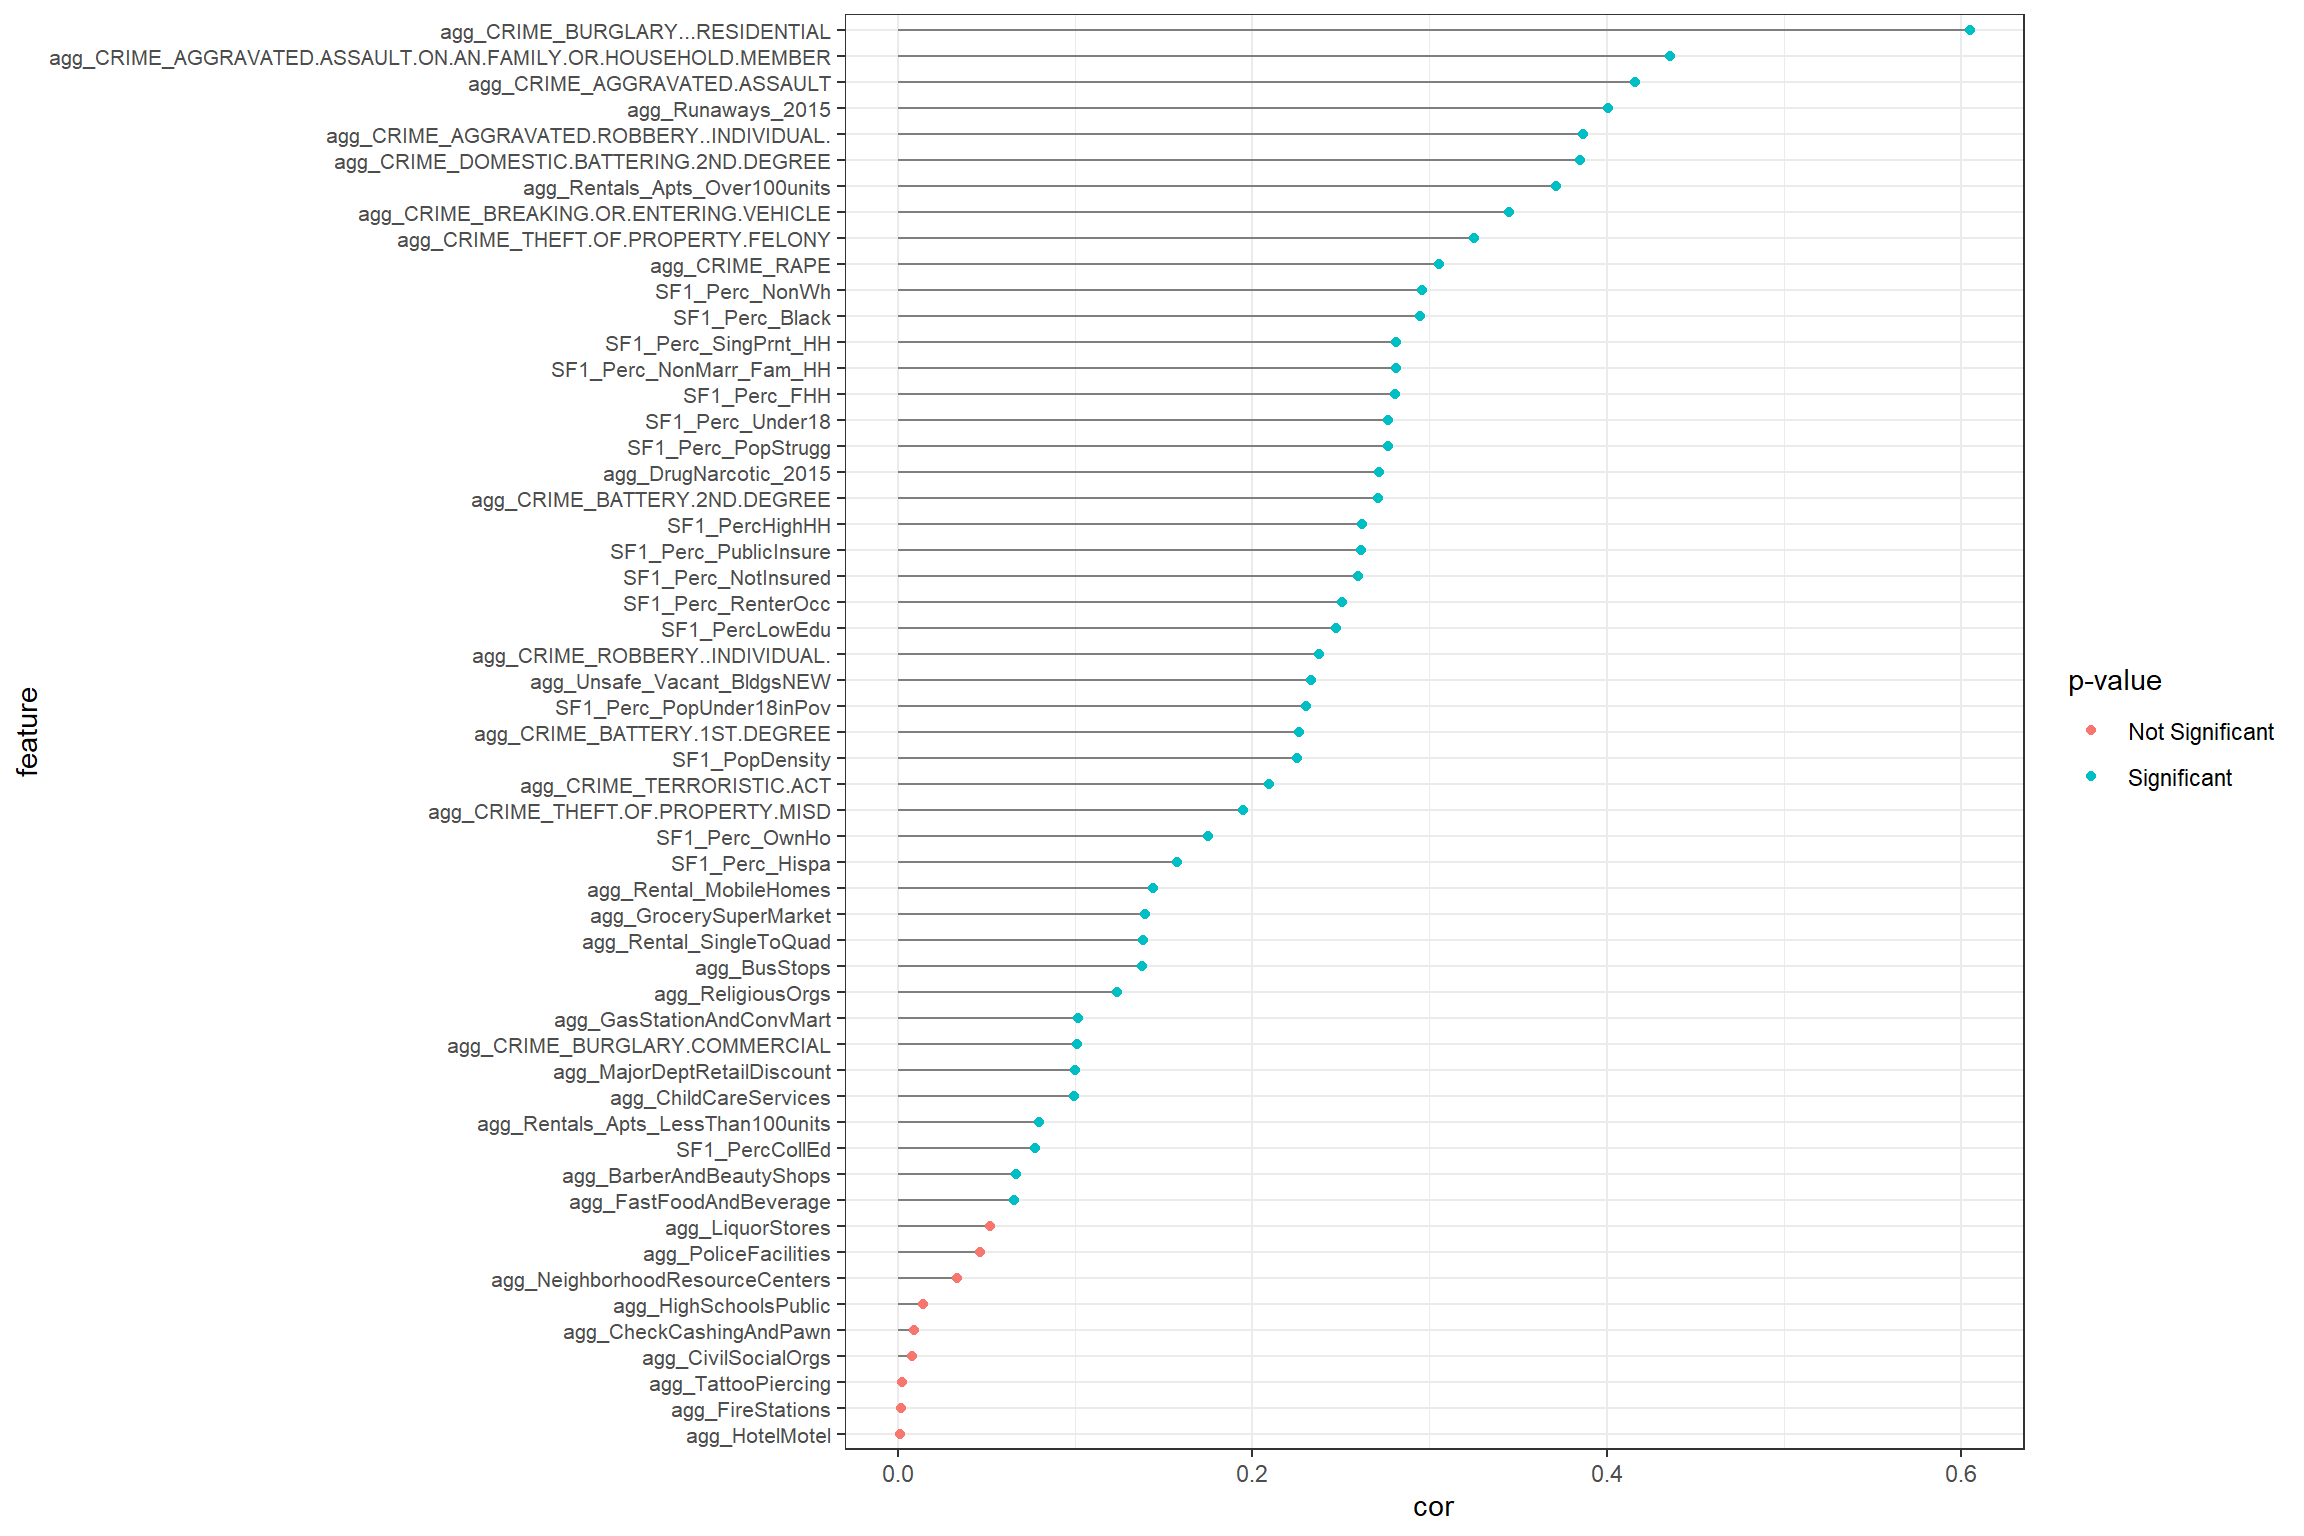
Child Maltreatment: Positively Correlated Variables
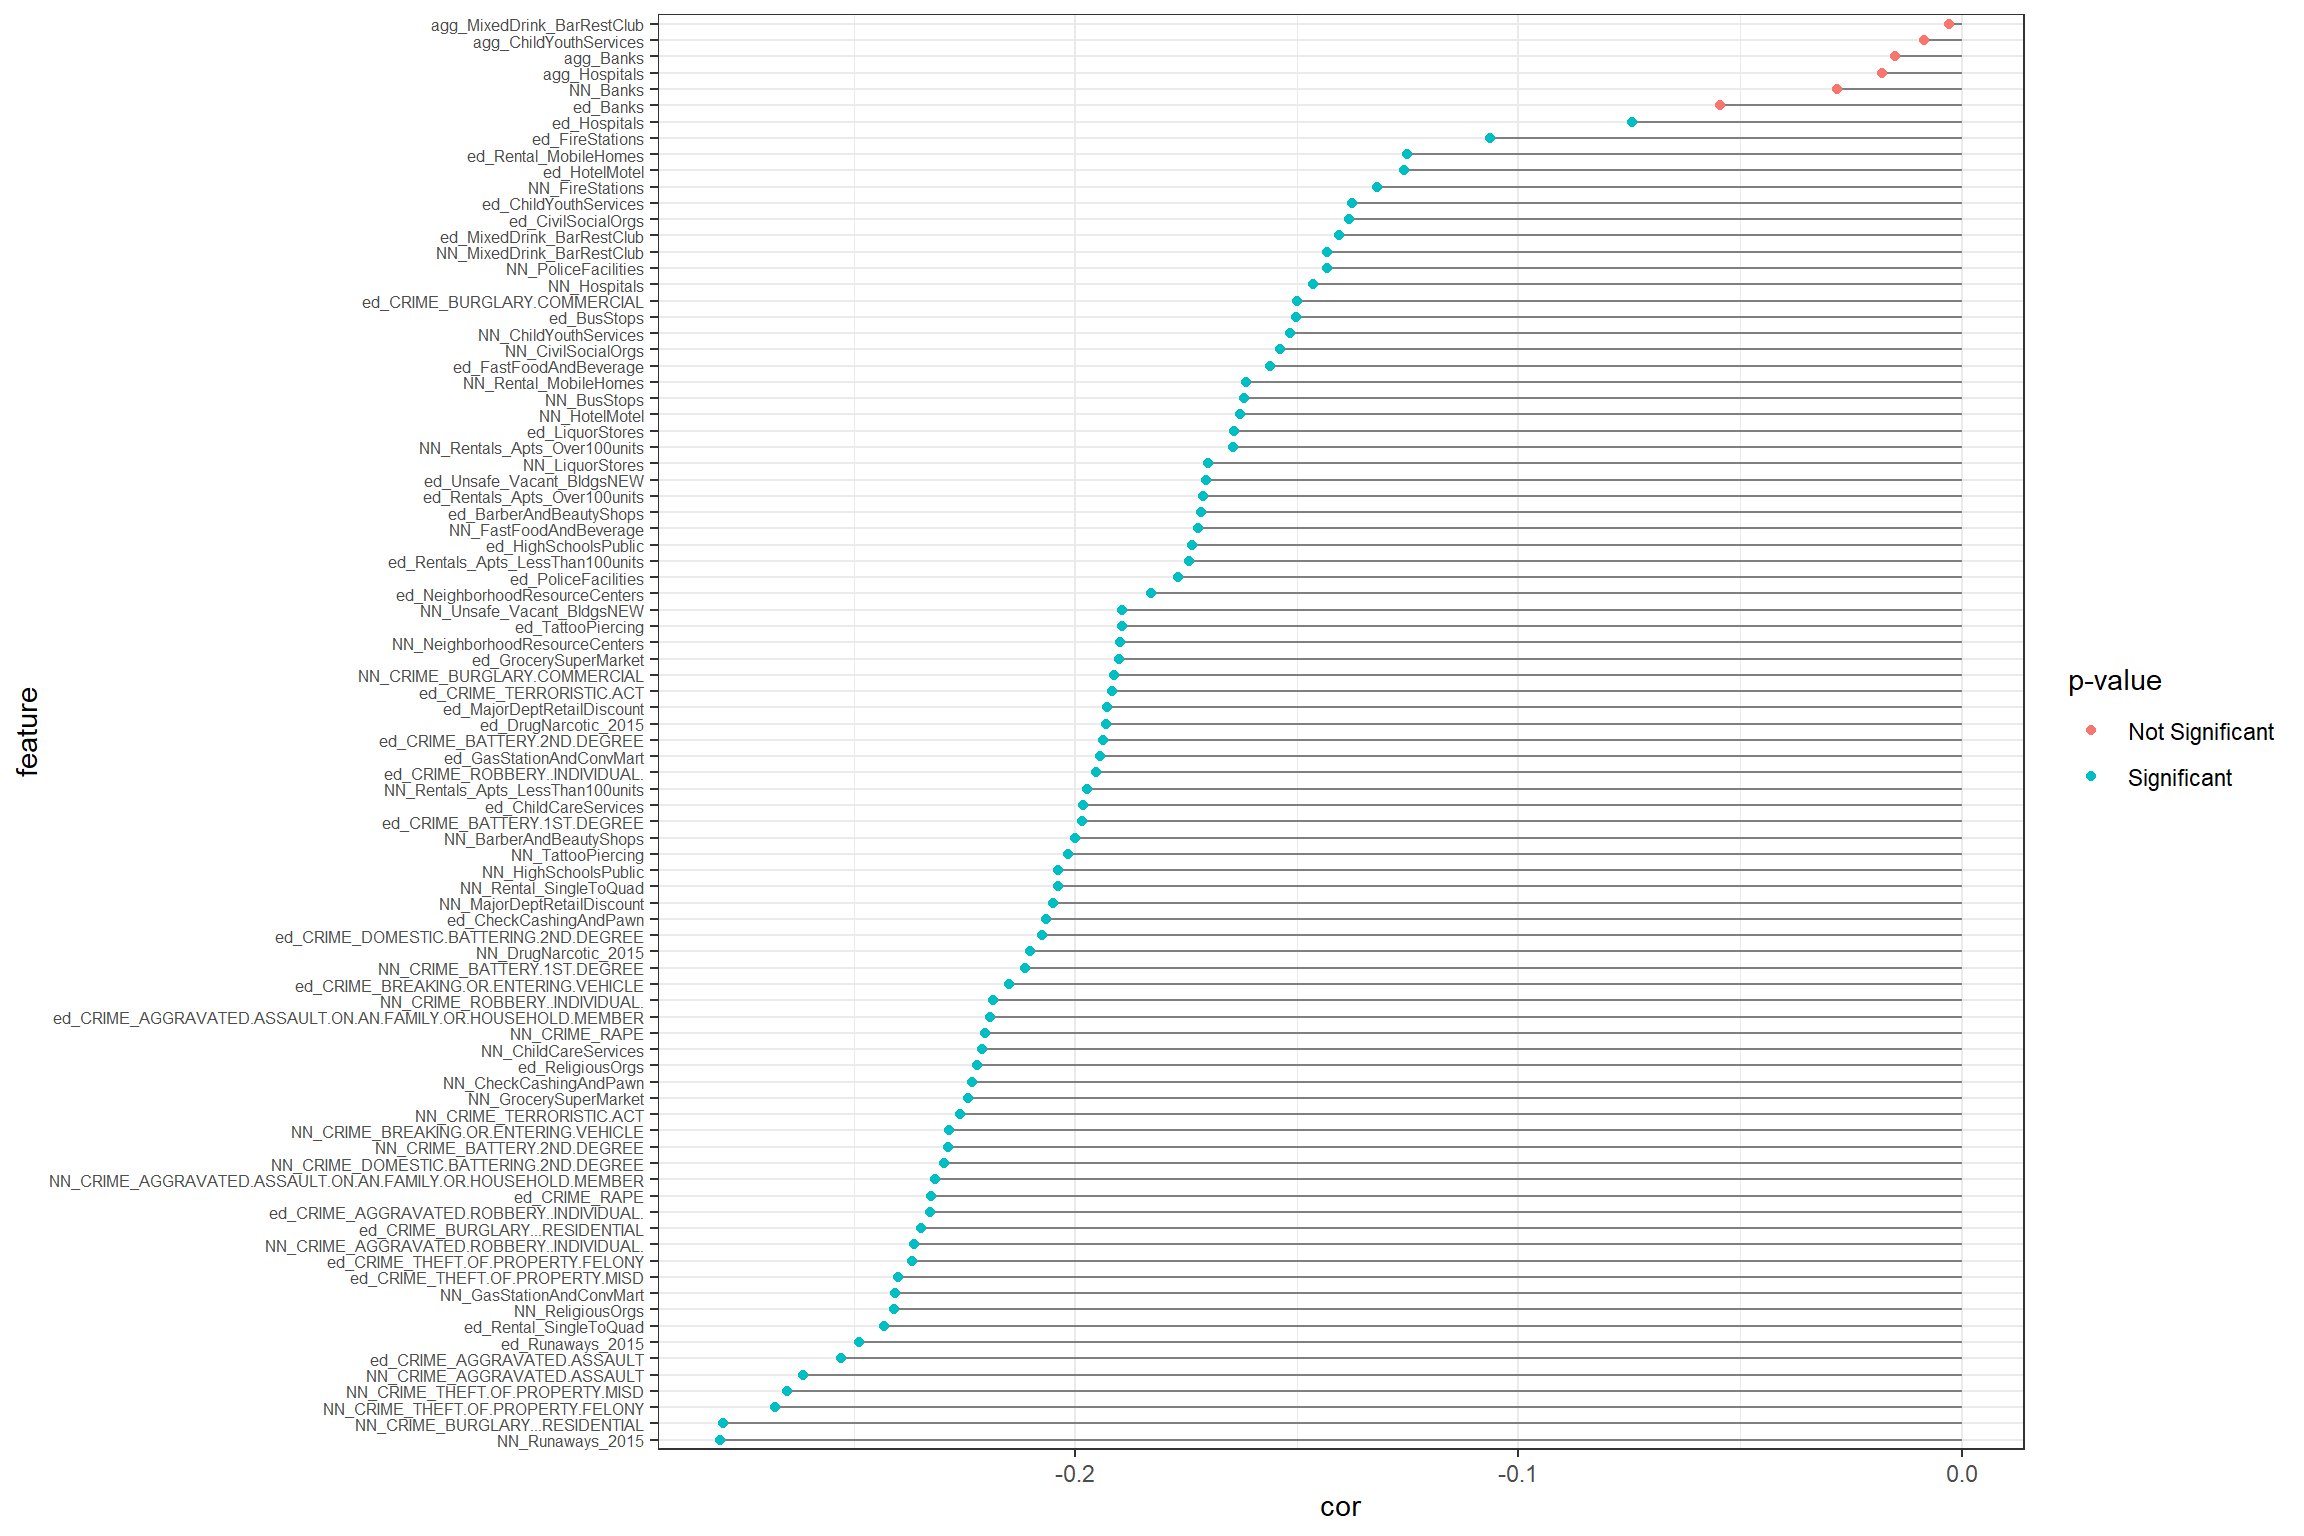
Child Maltreatment: Negatively Correlated Variables
Protective Factors
The following maps highlight a sample of where potential protective factors are located throughout Little Rock (click to view)
Civil and Social Organizations Child Youth Services Childcare Highschools Hospitals Pharmacies and Drugstores Police and Fire Religious Organizations SupermarketsThe maltreatment predictions suggest where education, outreach, and prevention efforts should occur.
What resources are available at these locations? To answer this question, a subset of the original protective factors data is aggregated for the model-building exercise. This approach can be replicated on any list of sites that are suitable to host these interventions.
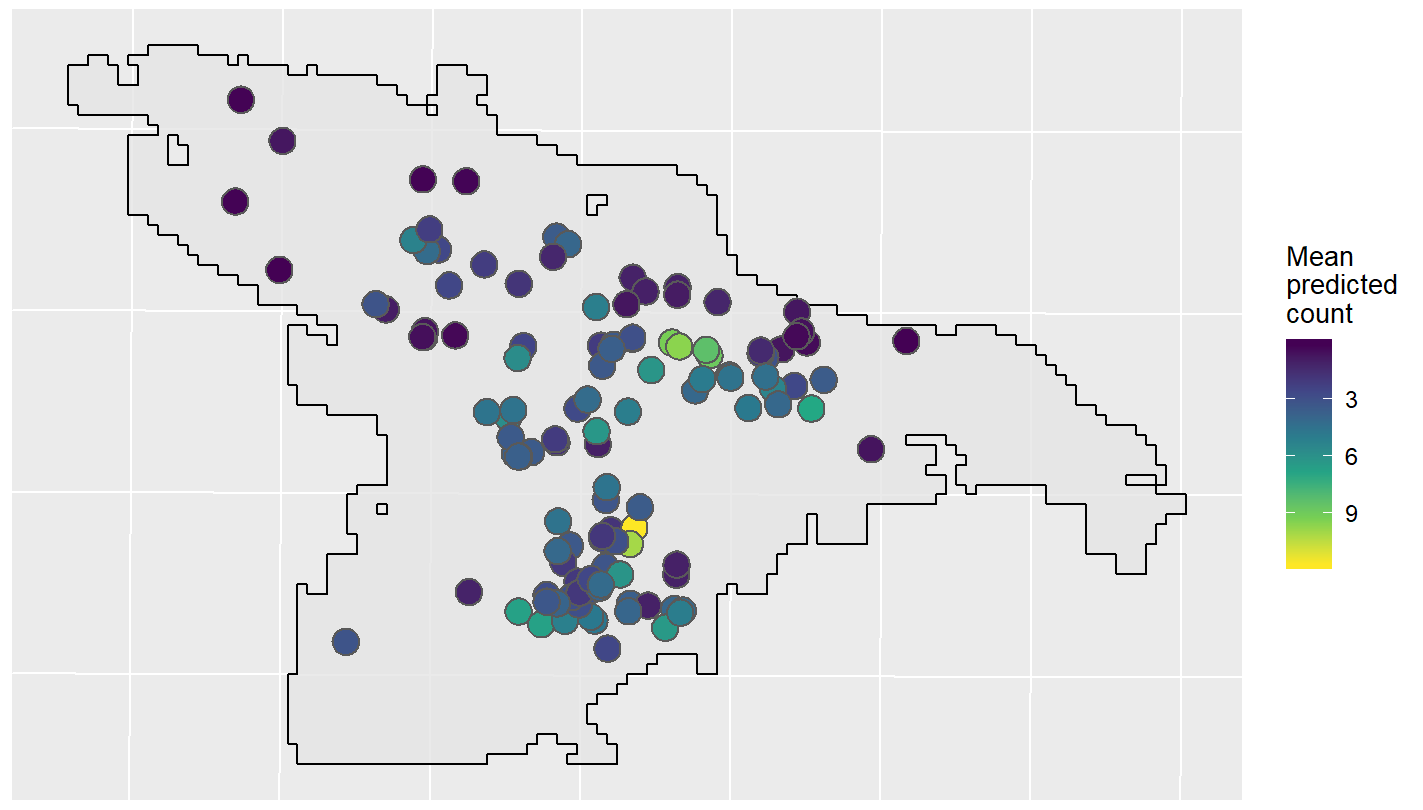
We then calculate a relative measure of risk exposure for each facility by drawing quarter-mile buffers around each site and taking the mean count of predicted events.
The figure below plots these buffers and the relative measure of risk exposure.
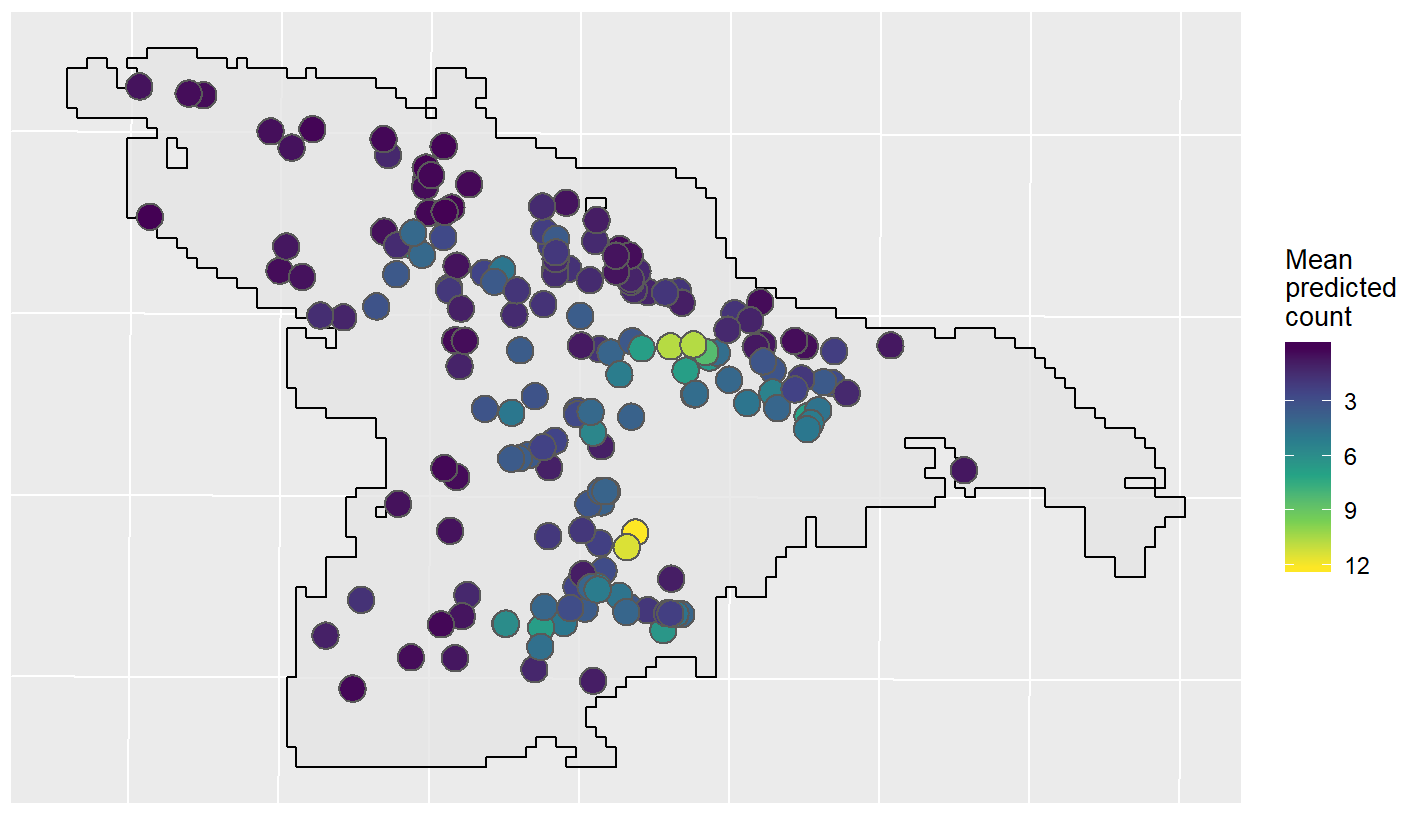
The table that follows lists the most optimally located facilities sorted by type and mean predicted count. The rationale for choosing a quarter-mile buffer is that it is a walkable distance, making it feasible for residents with transport limitations to reach by foot
| Facility Name | Facility Type | Address | Mean Predicted Count |
|---|---|---|---|
| Kennedy Headstart | Child Care Center | 4901 West 65th Street | 12 |
| Above And Beyond Child Care | Child Care Center | 80 Westminister | 11 |
| Buttons & Bows Learning Center Inc | Child Care Center | 4124 West 11th Street | 11 |
| Loving Care DCFH | Registered Child Care Family Home | 3505 West 10th | 11 |
| Redeemed for Christ | Child Care Center | 3105 W 12TH ST | 8 |
| Washington Magnet School | Child Care Center | 2700 South Main Street | 7 |
| Lrsd Care Program Washington Elementary | Child Care Center | 2700 South Main street | 7 |
| Stephens Elementary | Child Care Center | 3700 West 18th Street | 7 |
| In A Childs World | Child Care Center | 9420 Chicot Road | 7 |
| From A to Z Preschool | Child Care Center | 4923 W 12th Street | 7 |
TODO
- Show highest risk grid cells - bar graph how many LR folks live in high-risk areas
- Risk category population totals
- (Is poverty related to predicted maltreatment events? May want to wait to introduce this until segmentation section where we can compare these findings with Acxiom findings to highlight what was discovered.)
- Maltreatment risk and child fatalities
- Protective assets map create in ArcGIS layering in each group - have spreadsheet data for protective features
- Assign risk scores to protective land uses (DCFS facilities)
- Assign risk scores to protective land uses (child care and resource centers)
- Neighborhood Resource Centers
- Child Youth Centers
- Civil Social Organizations
- Possibly add positive and negative correlated variables
- What is U of A sharing regarding schools? Did they do CPTED?
- Need their version of Ken’s DC report. Will pull out key pieces and write-ups.
For VDSS we pulled out what the community shared - most likely to accept help from and then used most optimally located churches and prevention resource allocation map to illustrate - is there anything like this we could use from the LR community focus group data to tie need to lack of resources? Food banks and homeless shelters would seem to be very important per community input. We need story here.
Key Insights
Optimally located protective land uses
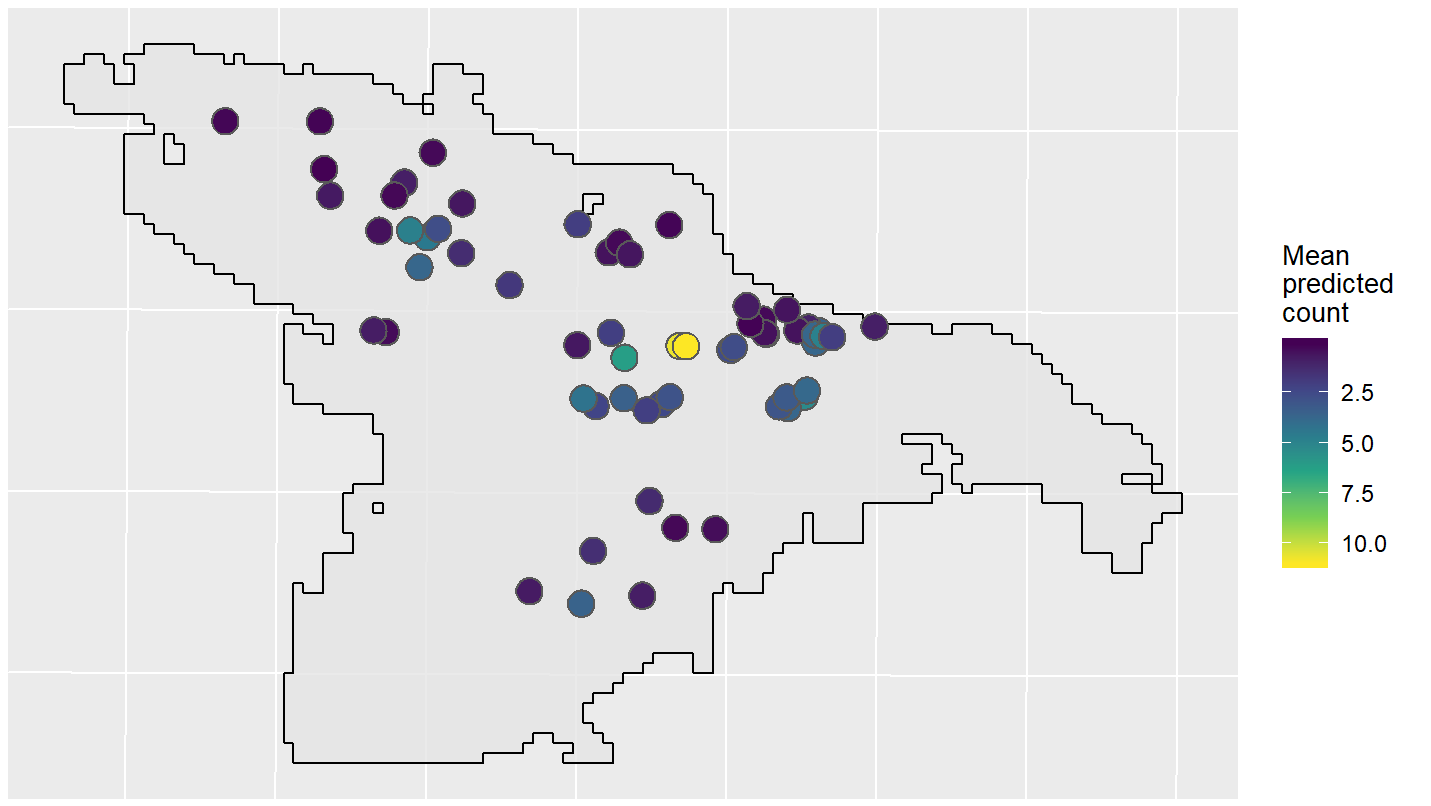
Optimally Located Child Care Centers
The following image plots the relative measure of risk exposure for quarter mile buffers around child care centers.
The following table lists the 5 most optimally located child care facilities based on mean predicted count of maltreatment events within a quarter mile.
| Facility Name | Address | Mean Predicted Count |
|---|---|---|
| TOUCHED BY AN ANGEL | 6402 BUTLER RD # E | 12 |
| KINDLE LOVIN CARE | 3914 W 12TH ST | 10 |
| ABOVE & BEYOND CHILD CARE CTR | 80 WESTMINISTER DR | 10 |
| BUTTONS & BOWS LEARNING CTR | 4124 W 11TH ST | 9 |
| YOUNG’S DAYCARE CTR | 1314 BOOKER ST | 9 |
Neighborhood Resource Centers
The following image plots the relative measure of risk exposure for quarter mile buffers around neighborhood resource centers.

This table lists the five most optimally located neighborhood resource centers based on mean predicted count of maltreatment events within a quarter mile.
| Facility Name | Address | Mean Predicted Count |
|---|---|---|
| Willie L Hinton Neighborhood Resource Center | 3805 W 12th Street | 11 |
| West Baseline Neighborhood Resource Center | 9209 Mann Road | 7 |
| Wright Avenue Neighborhood Resource Center | 1813 Wright Avenue | 5 |
| Southwest Little Rock Neighborhood Resource Center | 5621 Valley Drive | 5 |
| Oak Forest Neighborhood Resource Center | 2823 Tyler Street | 4 |
Child Youth Centers
The following figure plots the relative measure of risk exposure for quarter mile buffers around child youth centers.

The following table lists the 5 most optimally located child youth facilities based on mean predicted count of maltreatment events within a quarter mile.
| Facility Name | Address | Mean Predicted Count |
|---|---|---|
| DALTON WHETSTONE BOYS & GIRLS | 46 HARROW DR | 11 |
| B C D YOUTH CTR | 4000 W 13TH ST | 10 |
| EXTRAORDINARY YOUTH CTR | 6105 LANCASTER RD | 7 |
| HINTON GRAHAM & ASSOC | 100 S UNIVERSITY AVE # 207 | 5 |
| COUNSELING & PSYCHOLOGY SVC | 100 S UNIVERSITY AVE # 200 | 5 |
Civil and Social Organizations
This figure plots the relative measure of risk exposure for quarter mile buffers around civil social organizations.
The following table lists the 5 most optimally located civil social organizations based on mean predicted count of maltreatment events within a quarter mile.
| Facility Name | Address | Mean Predicted Count |
|---|---|---|
| WOMEN’S PROJECT | 3802 W 12TH ST | 11 |
| B C D INC | 3604 W 12TH ST | 11 |
| VINE & VILLAGE | 1605 FAIR PARK BLVD | 6 |
| AMERICAN LEGION MM EBERTS | 315 E CAPITOL AVE | 5 |
| WOMEN’S PROJECT | 2224 MAIN ST | 5 |
References
- Daley D., Bachmann M., Bachmann B.A., Pedigo C., Bui. M.T., & Coffman J. (2016). Risk terrain modeling predicts child maltreatment. Child Abuse Neglect. 62:29-38. doi:10.1016/j.chiabu.2016.09.014. https://www.sciencedirect.com/science/article/pii/S0145213416301922
- Predict Align Prevent (2019). Richmond, Virginia Technical Report. https://b9157c41-5fbe-4e28-8784-ea36ffdbce2f.filesusr.com/ugd/fbb580_2f1dda2ff6b84f32856bc95d802d6629.pdf