Loading . . .

REPORT SECTIONS:    Intro    Predict     Align     Psychographics     Community     Recommendations     Ahead    

Little Rock's Predict Phase

Start with the facts - Geospatial machine learning predictions identify the places where children are at greatest risk of maltreatment, ranking the most important risk features by correlation to child maltreatment events

GEOSPATIAL RISK AND PROTECTIVE FACTOR ANALYSIS:

An Overview of the Data Analysis Process During the PAP Program

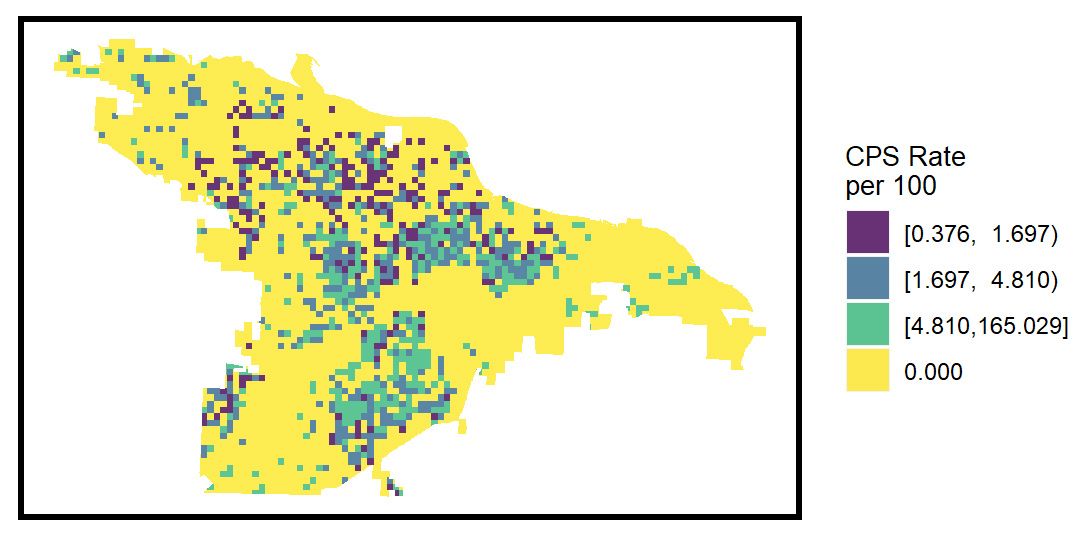
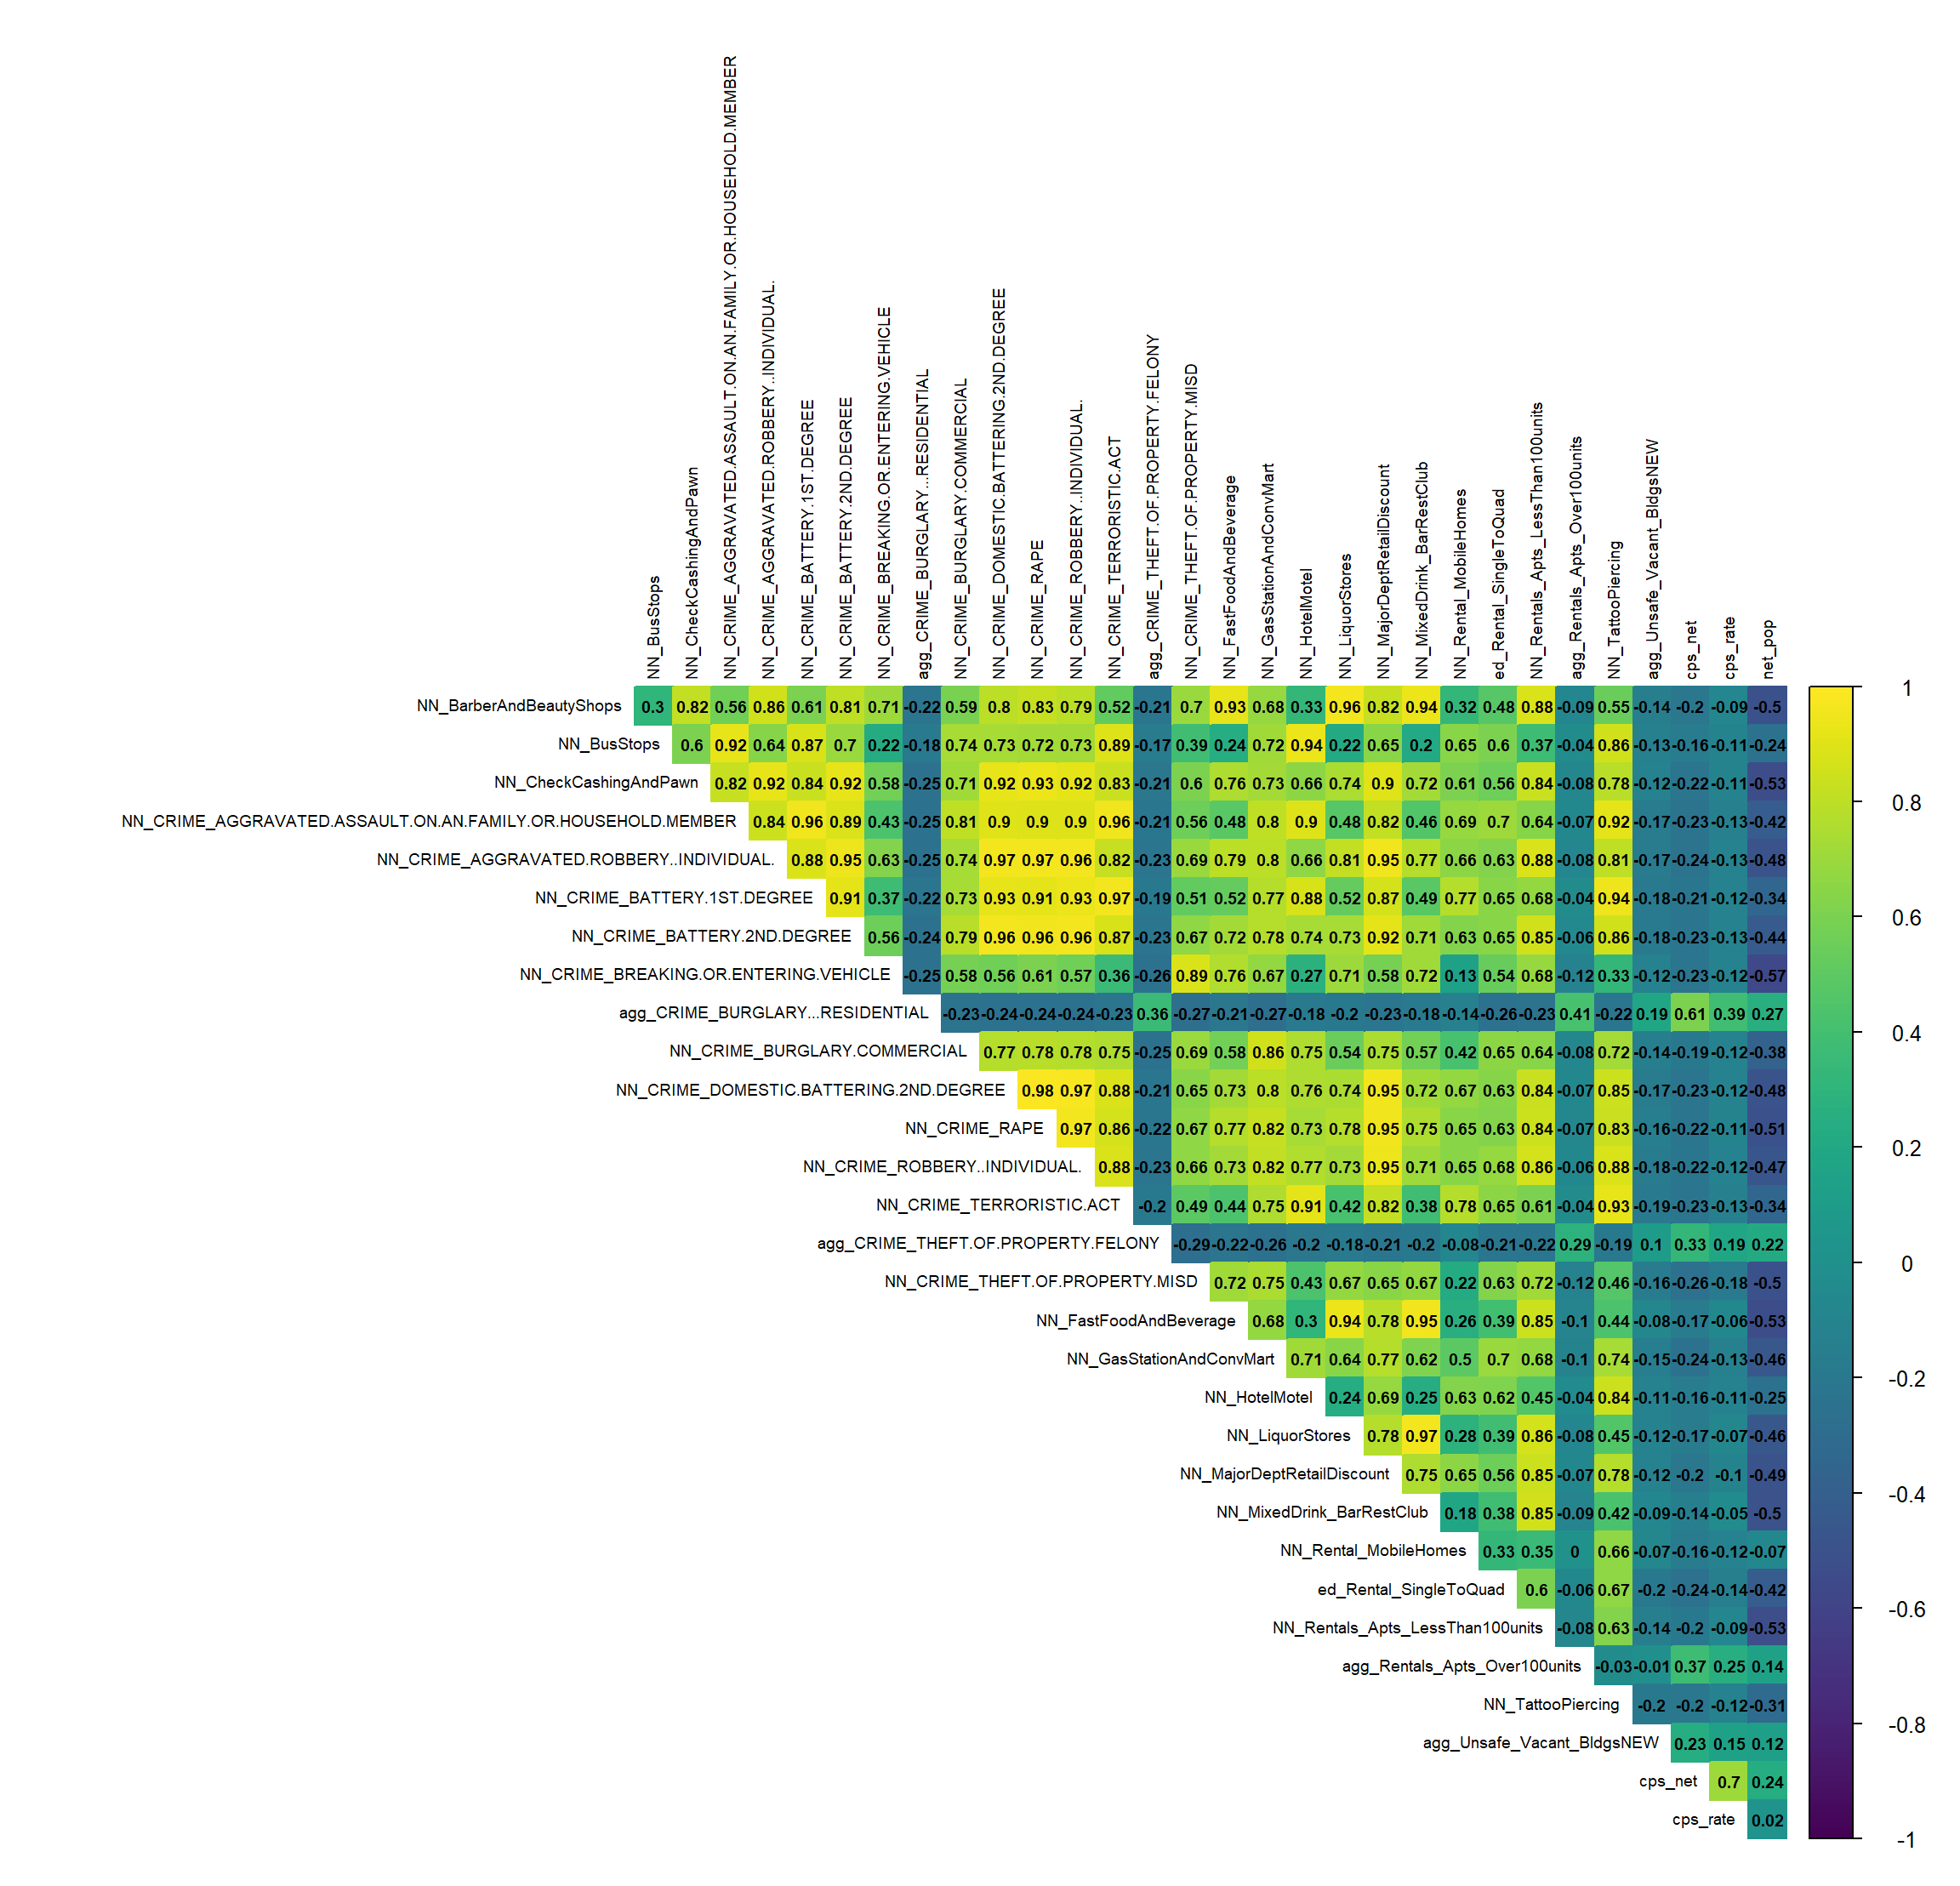
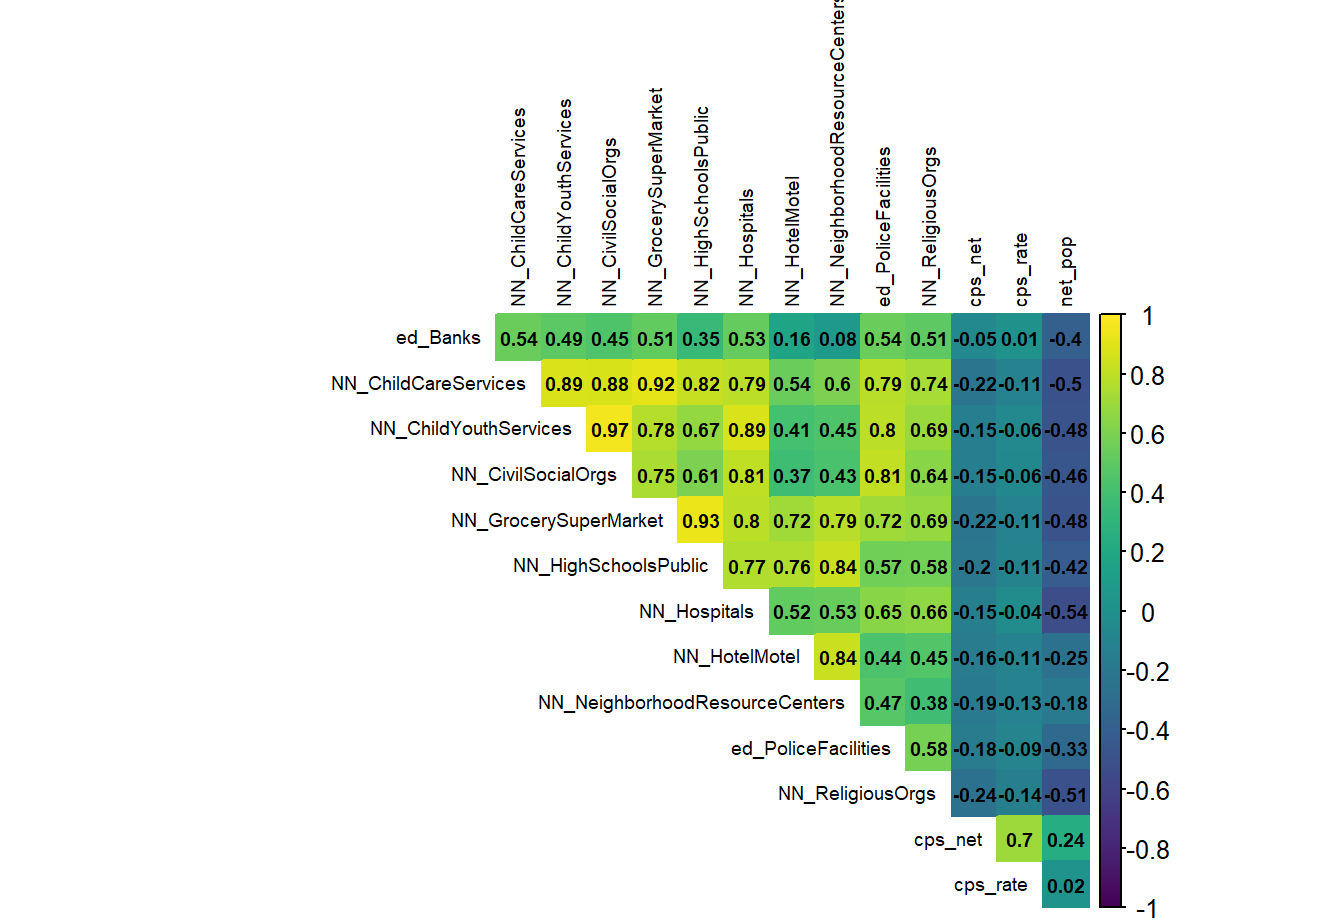
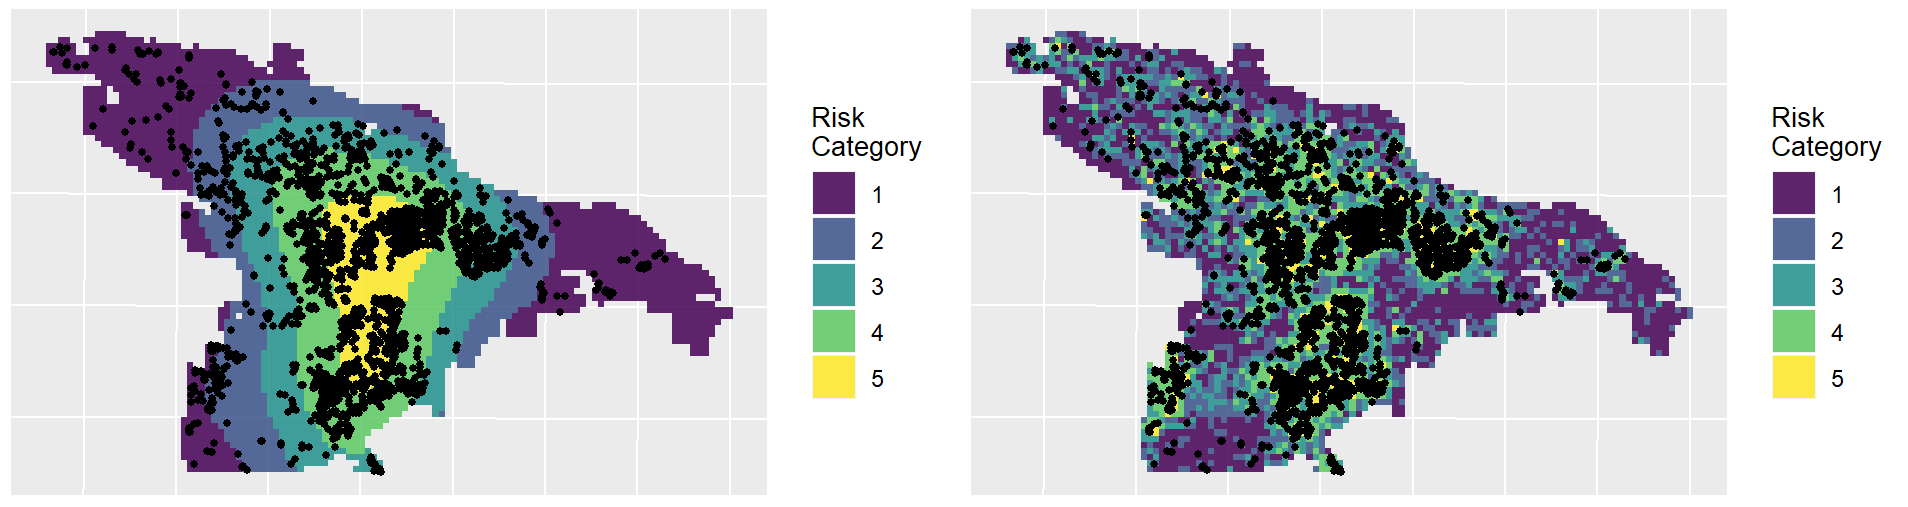
The intuition behind the modeling process is to borrow the observed maltreatment ‘experience’ and test whether those experiences are generalizable to places where maltreatment may occur but are not directly observed. This is done by using data associated with ‘neighborhood effects’ (individual, family, and household-level factors) that may be influencing maltreatment.

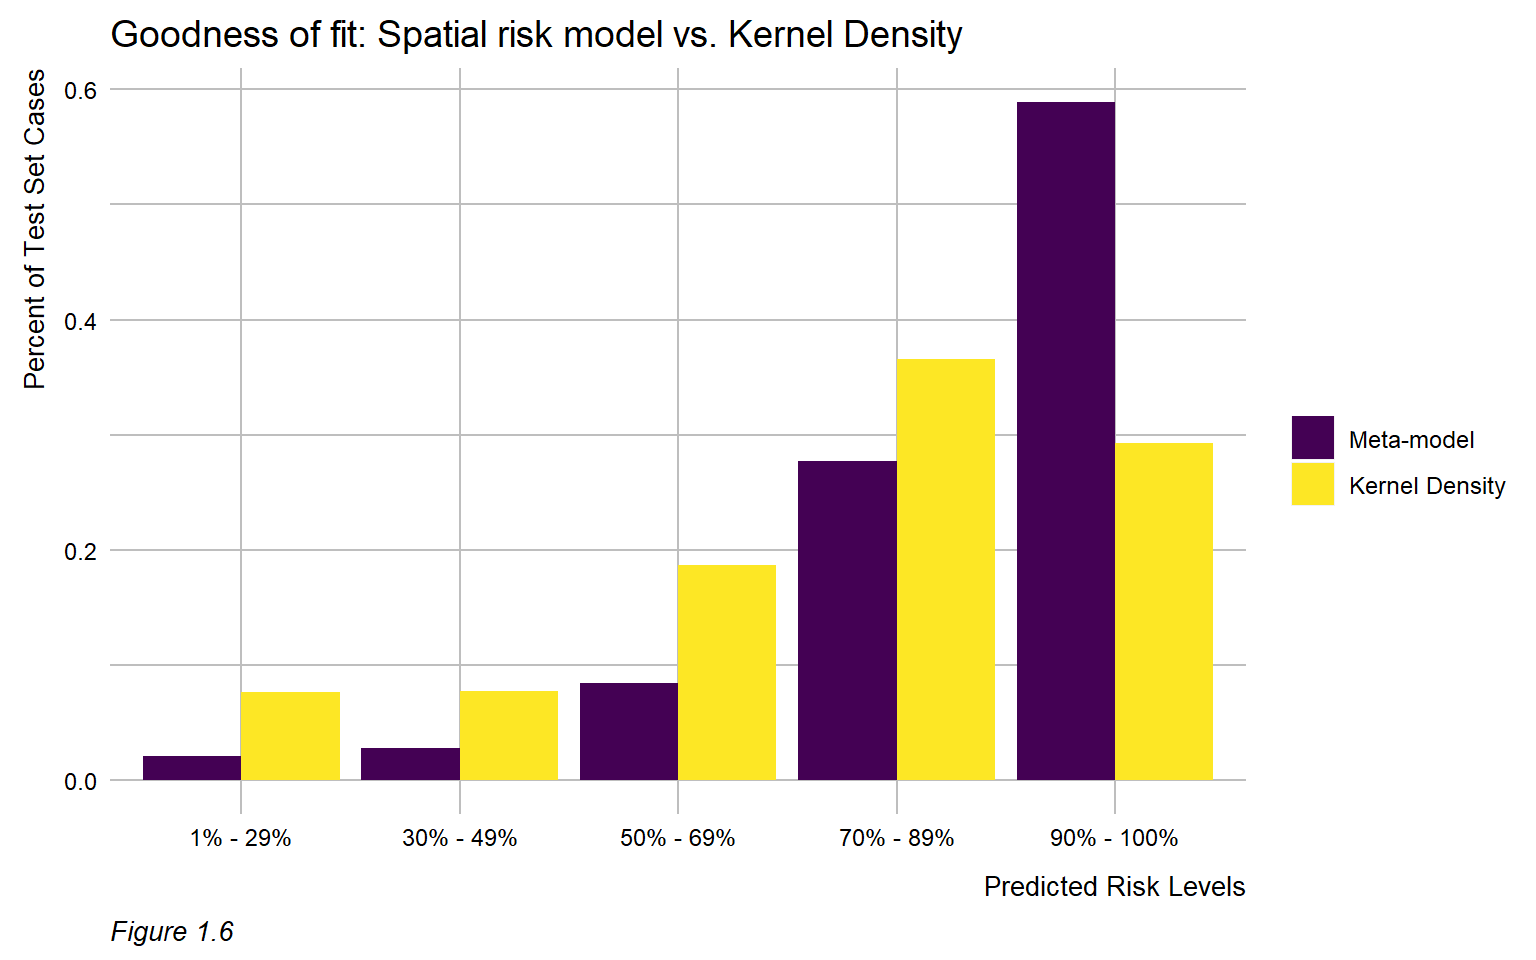
A model that is very accurate will not generalize well to other areas because exposure of maltreatment varies across space. Vice versa, a model that is too generalizable will not be accurate enough to make decisions confidently.

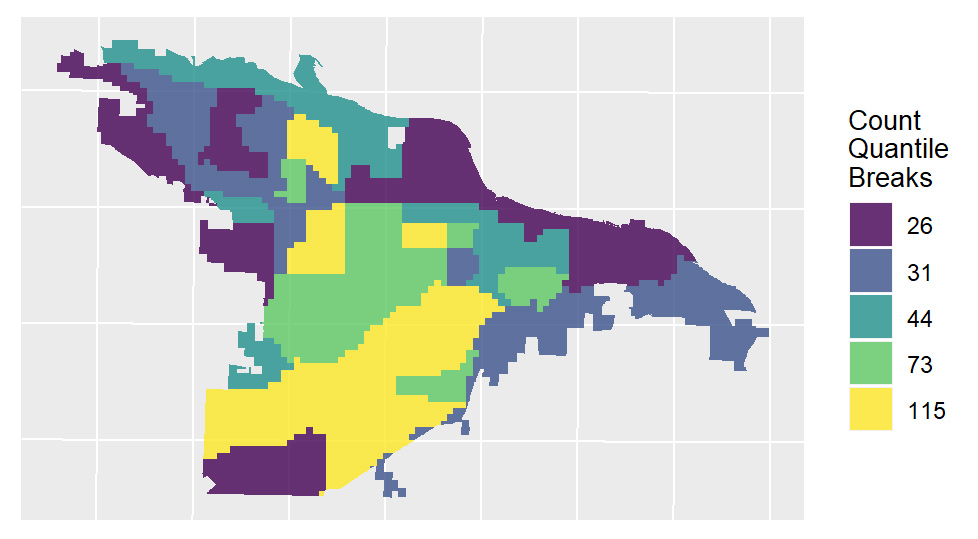
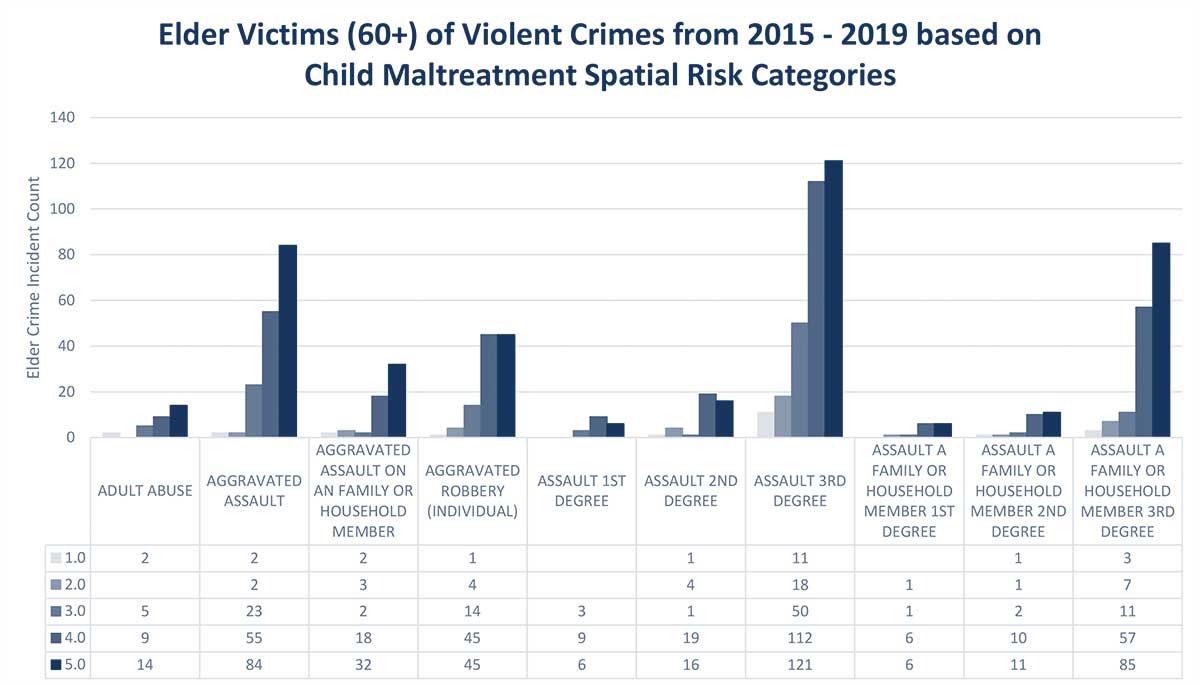
By focusing on this tradeoff, the final predictive model is able to produce highly targeted spatial risk predictions. These risk predictions are split into five risk categories, with five being the greatest risk.

These risk predictions can then be used to evaluate whether the supply of child welfare services is properly aligned with the demand for these services. This is done by embedding the risk predictions into a strategic planning framework that helps identify resources that are optimally located relative to maltreatment risk. It is at these locations that stakeholders may wish to deploy education, outreach, and treatment programs.

Highlights

of our Little Rock geospatial analysis

For the complete analysis report click here

Motivation for the Analysis

This report outlines a statistical prediction/inference framework and modeling structure for spatially referenced child maltreatment events in Little Rock between 2015 and 2018. The underlying premise is to aggregate multiple spatial events to a common underlying geography by looking at the counts of events in pre-defined raster cells, and build a statistical or machine learning framework, that accounts for both social and environmental (physical - built) factors as well as the spatial clustering of both the response events and other factors and resources.

To visualize the extent of spatial clustering, the figure below displays the count of maltreatment events between July 2015 and June 2018 by census tracts. This figure demonstrates that the spatial distribution of child maltreatment is far from uniformly distributed across tracts. Thus, a critical question is allocation of limited child welfare resources to the communities that are most severely affected.

To identify locations that will need the most resources we must first determine where child maltreatment events are clustered. While individual, family, and household level factors affect child maltreatment, extant research suggests that community and social factors play an important role in understanding where maltreatment may occur .

The maltreatment event clusters are visualized below which maps the rate of child maltreatment events in Little Rock, AR between 2015 and 2018. Recent work indicates that variation in these spatial clusters can be predicted by environmental factors such as crime, blight, and bars and restaurants.

Exploratory Analysis

During this process, a number of descriptive insights from the data are derived. To begin, maltreatment events across space and time are visualized and possible selection bias in the data is discussed. Next, hypotheses related to the clustering of maltreatment events across space are presented. Finally, a series of pairwise correlations between maltreatment and the features.

Testing maltreatment events for clusters

One overarching assumption behind the model is that maltreatment events are clustered in space. To test this hypothesis, the Local Moran’s I statistic is employed, comparing CPS count by fishnet to Local Moran's I value: the result shows areas that resemble discrete clusters of maltreatment in space.

Spatial Autocorrelation via Moran's I

Feature Engineering

In this section we seek to understand the extent of the linear relationship between the available features. Towards this end, we first create several features from the available data (i.e. built environment factors and census data). The two figures below visualize pairwise correlations for the most correlative risk and protective factors, respectively. Note the correlation coefficients associated with maltreatment count (cps_net) and maltreatment rate (cps_rate). The colors of the plot vary with the strength of the correlations, either positive or negative.

There are 3 different prefixes associated which each type of feature. NN refers to features calculated by taking the average distance between a fishnet grid cell and its n nearest risk/protective factor neighbor. ed refers to the Euclidean distance between a fishnet grid cell and its 1 nearest risk/protective factor neighbor. agg refers to the count of risk/protective factor events in a given fishnet grid cell.

Correlation of Risk Features


Correlation of Protective Features

Risk Factors

The following maps highlight a sampling of where potential risk factors are located throughout Little Rock (click to view)

Banks Barber and Beauty Shops Bus Stops Gas and Convenience Stores Hotels and Motels Liquor Stores Mobile Homes Rentals Restaurants and Bars Tobacco Sales

Comparing meta-model predictions to Kernel Density

Perhaps the strongest method for assessing the usefulness of a predictive model is to compare its predictive power to that of the current resource allocation strategy. Here we compare our model to another common spatial targeting algorithm -Kernel Density Estimation (KDE).

KDE is a simple spatial interpolation technique that calculates 'predicted risk' by taking a weighted local density of maltreatment events. No risk/protective factors are used, and no measures of statistical significance can be calculated. To compare between the meta-model predictions and KDE, predictions from both are divided into five risk categories for the purposes of comparison. We then overlay held out maltreatment events that werenot used to fit the original model and calculate the percent of observed maltreatment events that fall into each predicted risk category.

The following images map the comparison. The KDE clearly picks up the main areas of recorded events, but also interpolates high predictions for maltreatment in the areas between and beyond. The meta-model is far more targeted.

The following chart formalizes the comparison. The highest risk category for the meta-model captures approximately 60% of the recorded maltreatment events, whereas the KDE captures only about 35%.This suggests that the spatial risk model vastly outperforms KDE

Key insights

For Little Rock, We found:

53% of ALL preventable child deaths occurred in our identified highest risk places for child maltreatment

These include:

  • premature birth
  • suffocation
  • homicide
  • suicide
  • overdose
  • poisoning
  • drowning
  • late access to care for sepsis or pneumonia, etc.

Most removals into foster care also originate from the highest risk places

Catchment areas of elementary schools with low 3rd-grade reading proficiency correspond with the high risk areas as well


We also discovered the majority of violent crimes against elders (elder abuse) occur in the highest risk places for child maltreatment

Remember - only 15% of the total population lives in our identified highest risk areas

Prevention efforts can effectively be targeted to address multiple issues, providing the greatest impact for the residents of Little Rock

Click to Continue to Align Section

References

  • Daley D., Bachmann M., Bachmann B.A., Pedigo C., Bui. M.T., & Coffman J. (2016). Risk terrain modeling predicts child maltreatment. Child Abuse Neglect. 62:29-38. doi:10.1016/j.chiabu.2016.09.014. https://www.sciencedirect.com/science/article/pii/S0145213416301922
  • Predict Align Prevent (2019). Richmond, Virginia Technical Report. https://b9157c41-5fbe-4e28-8784-ea36ffdbce2f.filesusr.com/ugd/fbb580_2f1dda2ff6b84f32856bc95d802d6629.pdf
Visit www.Predict-Align-Prevent.org

Contents Copyright © 2021 Predict-Align-Prevent and respective rightsholders. Some rights reserved.