Loading . . .

REPORT SECTIONS:    Intro    Predict     Psychographics     Align     Recommendations     Ahead    

New Hampshire’s Predict Phase

Needs Assessment Maps were created for:

  • Manchester
  • Winnipesaukee Region
  • Greater North Country

The maps illustrate where and what prevention efforts are likely to have the greatest prevention impact.

Analysis Data Included

  • Child Protection: screened-in allegation reports, founded assessments, removals, provider/foster homes
  • Juvenile Justice: removals, petitions filed, petitions found true
  • Hospital Discharge: emergency department visits and hospitalizations -- substance use, intentional injury, assault, prevention quality indicators
  • Childhood Lead Poisoning
  • Vital Records: child mortality, premature death, suicide, homicide
  • New Heights: service eligibility
  • See Click Fix: community non-emergency logger, parking enforcement, graffiti, abandoned furniture, nonemergency police
  • OpenStreetMap points of interest: laundries, bars, supermarkets, places of worship, hospitals, fire stations, libraries, courts, convenience stores

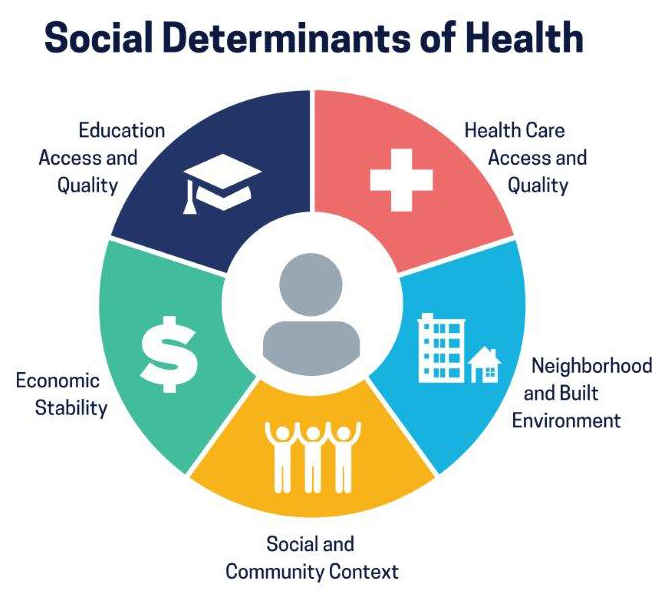
The goal behind the modeling process is to use the observed data around maltreatment experiences and test whether those experiences are common to places where maltreatment may occur but are not directly observed. This is done by using data associated with ‘neighborhood effects’ (individual, family, and household-level factors) that may be influencing maltreatment, such as substance use, education neglect, poverty, among others.

This process helps balance factors that are unique to certain regions and factors that are common to multiple regions; finding this balance segregated by common areas, or areas with similar factors, is important to assist making decisions confidently.

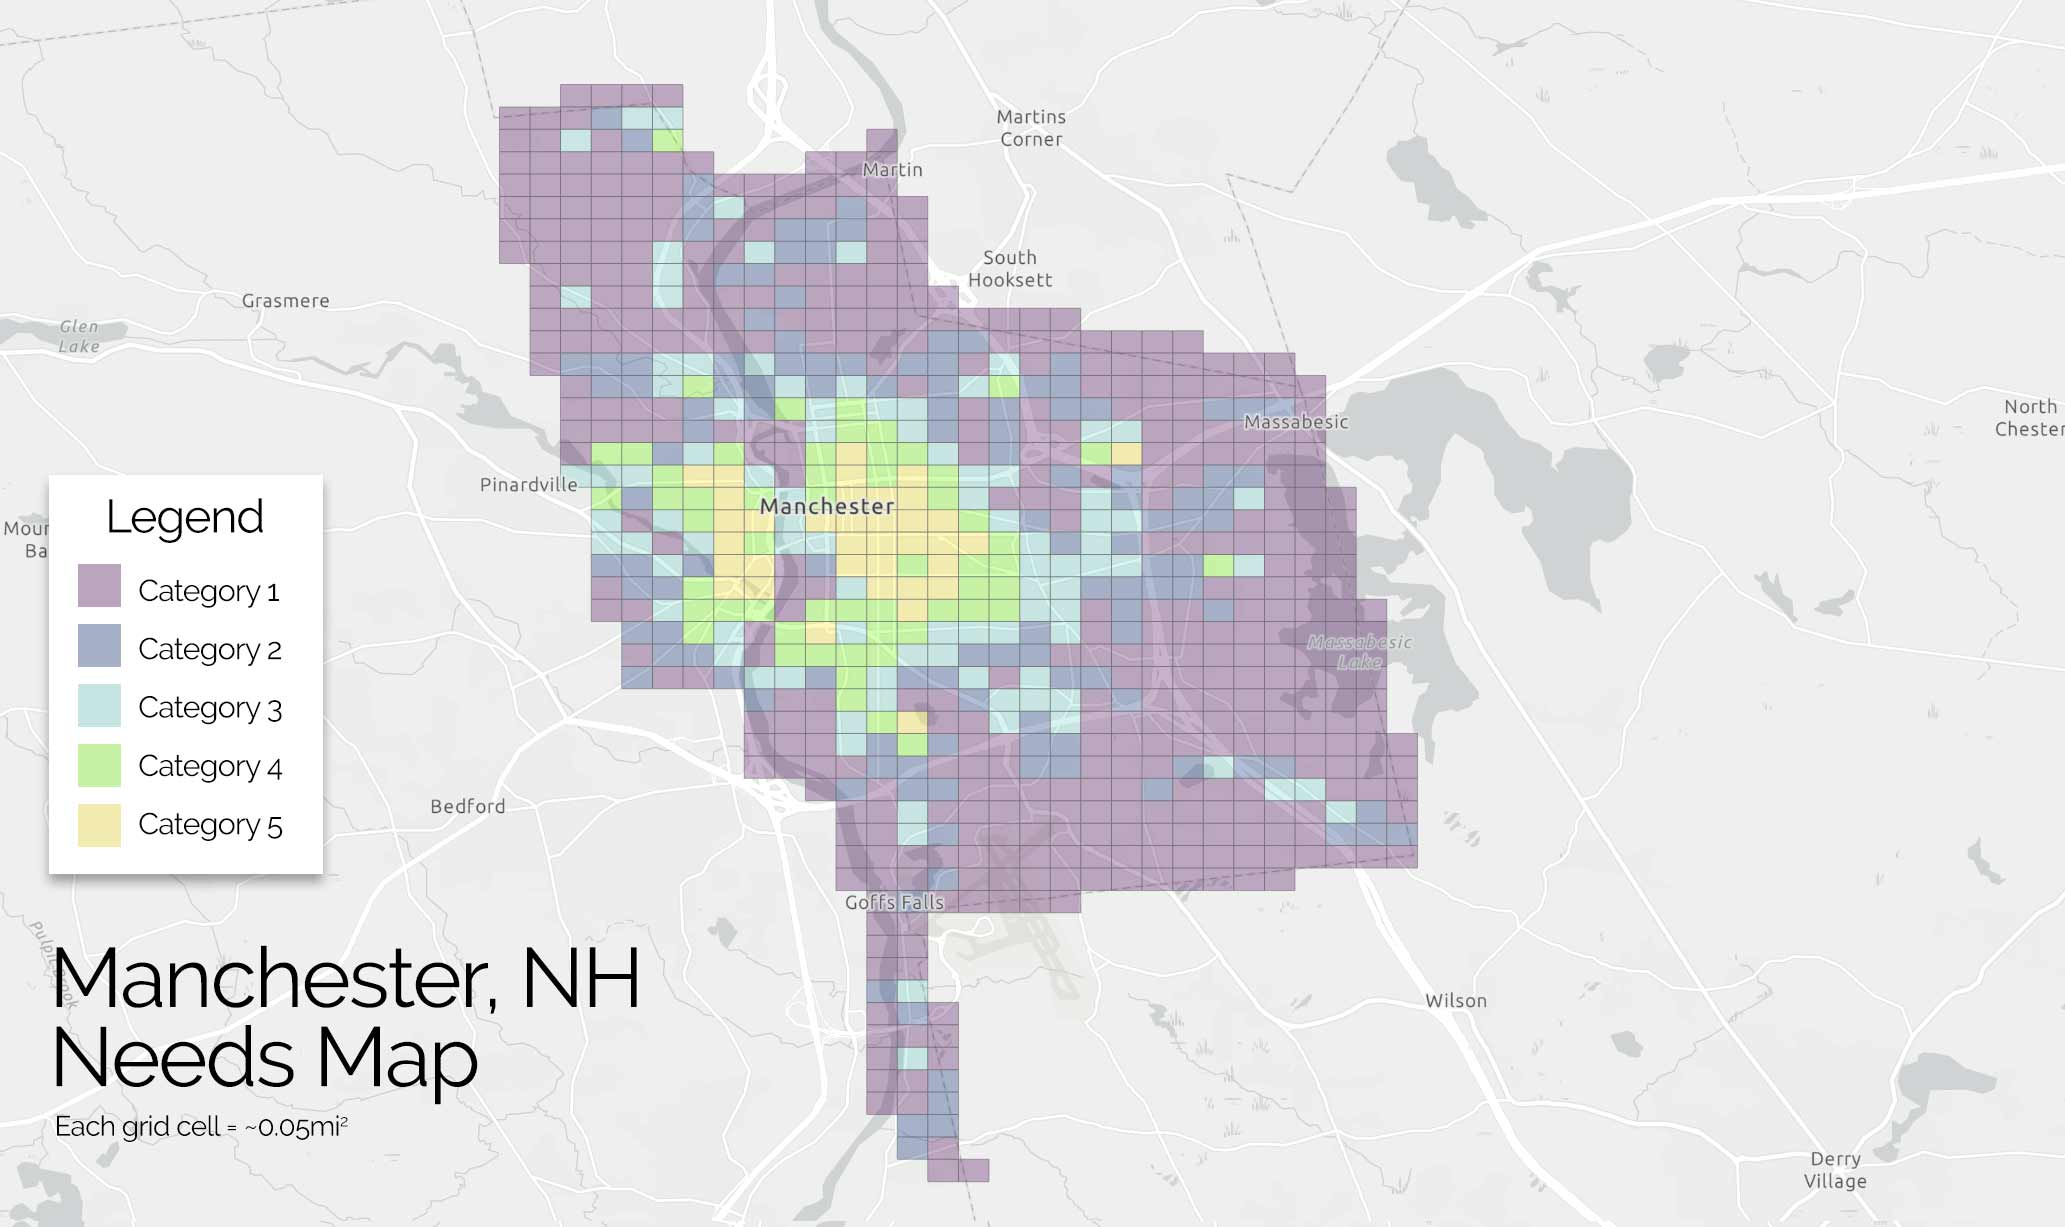
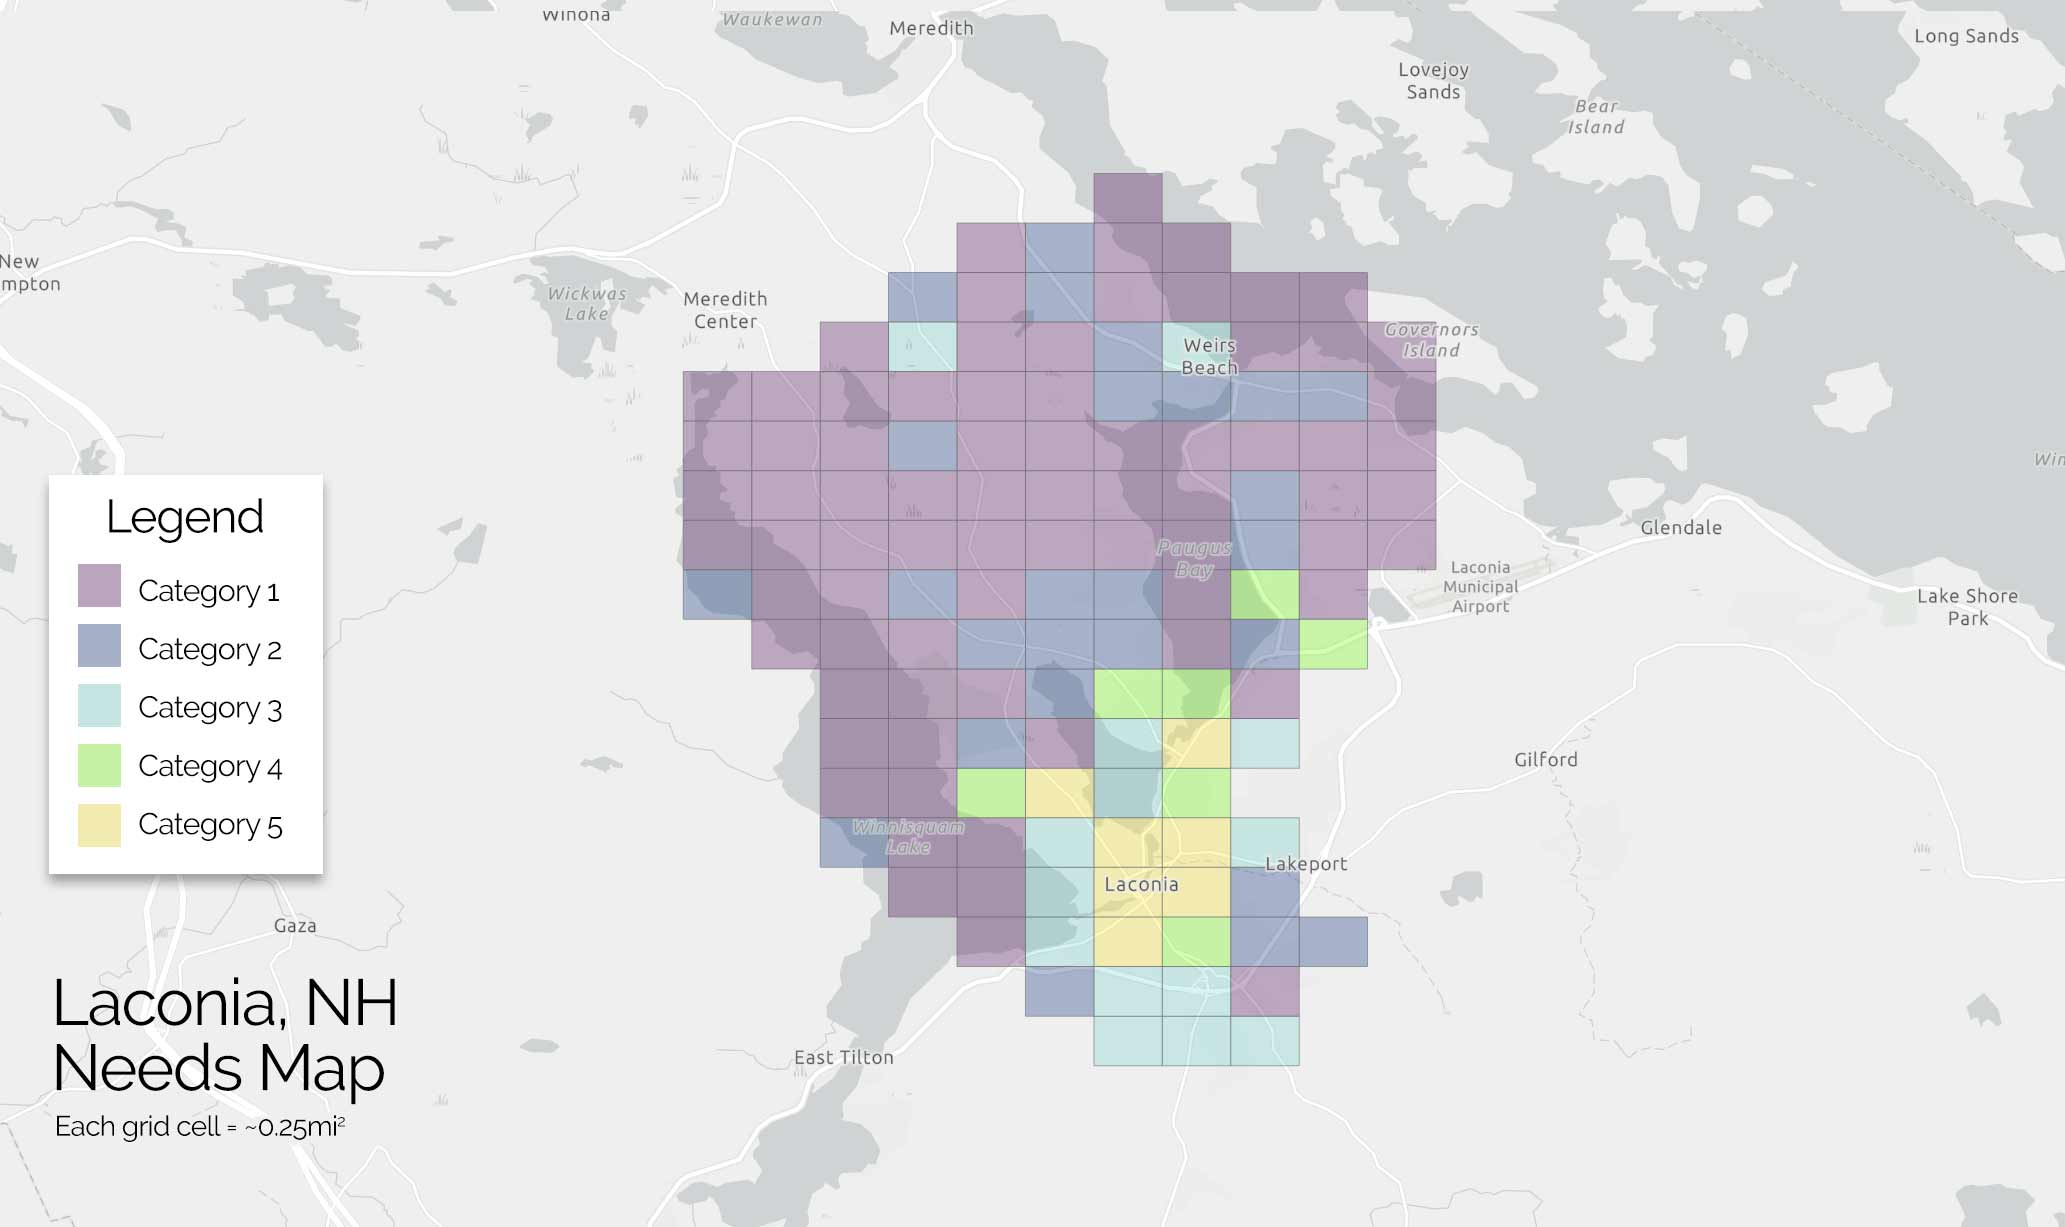
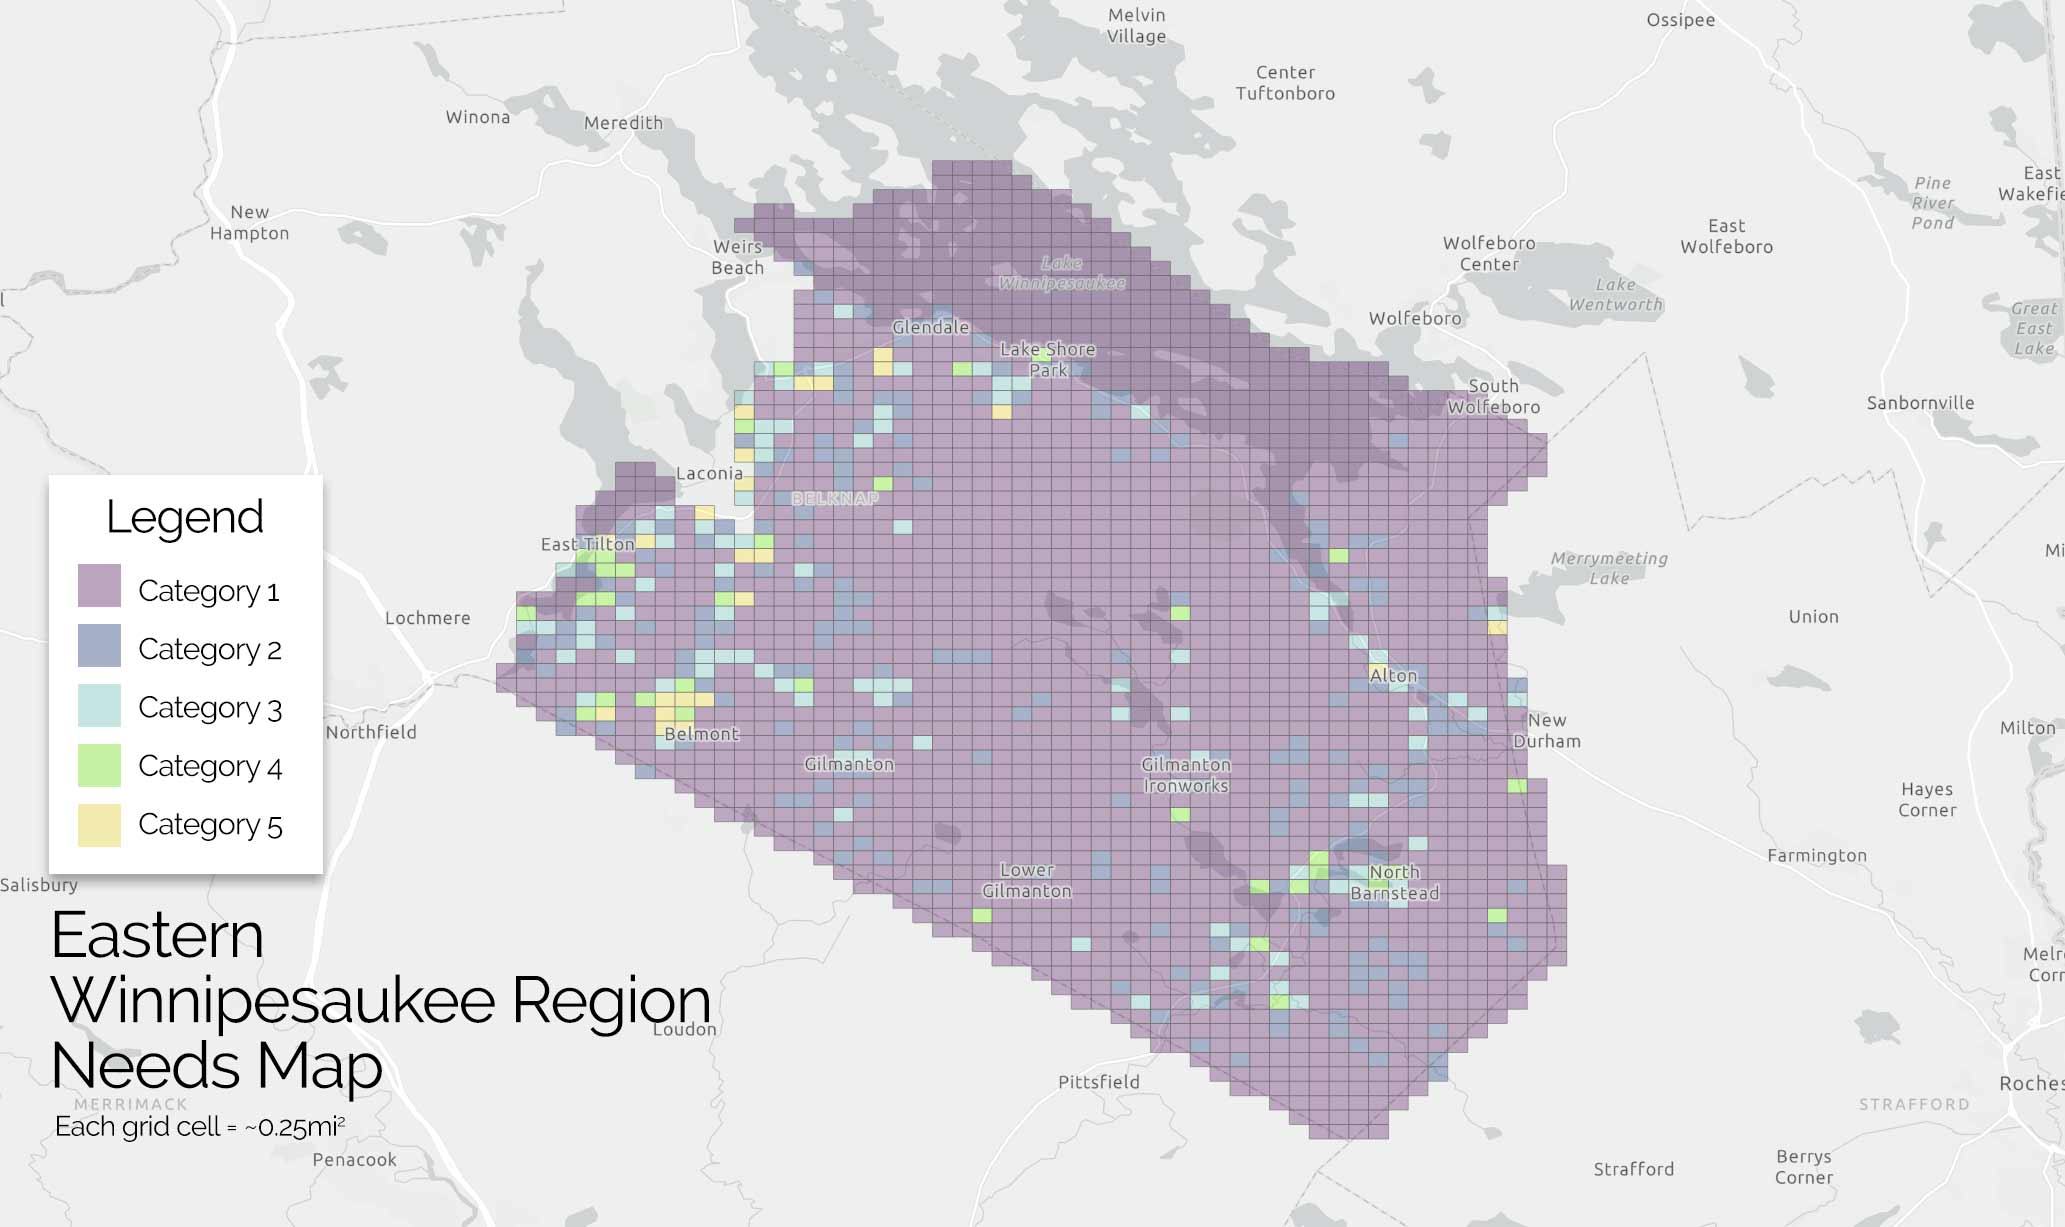
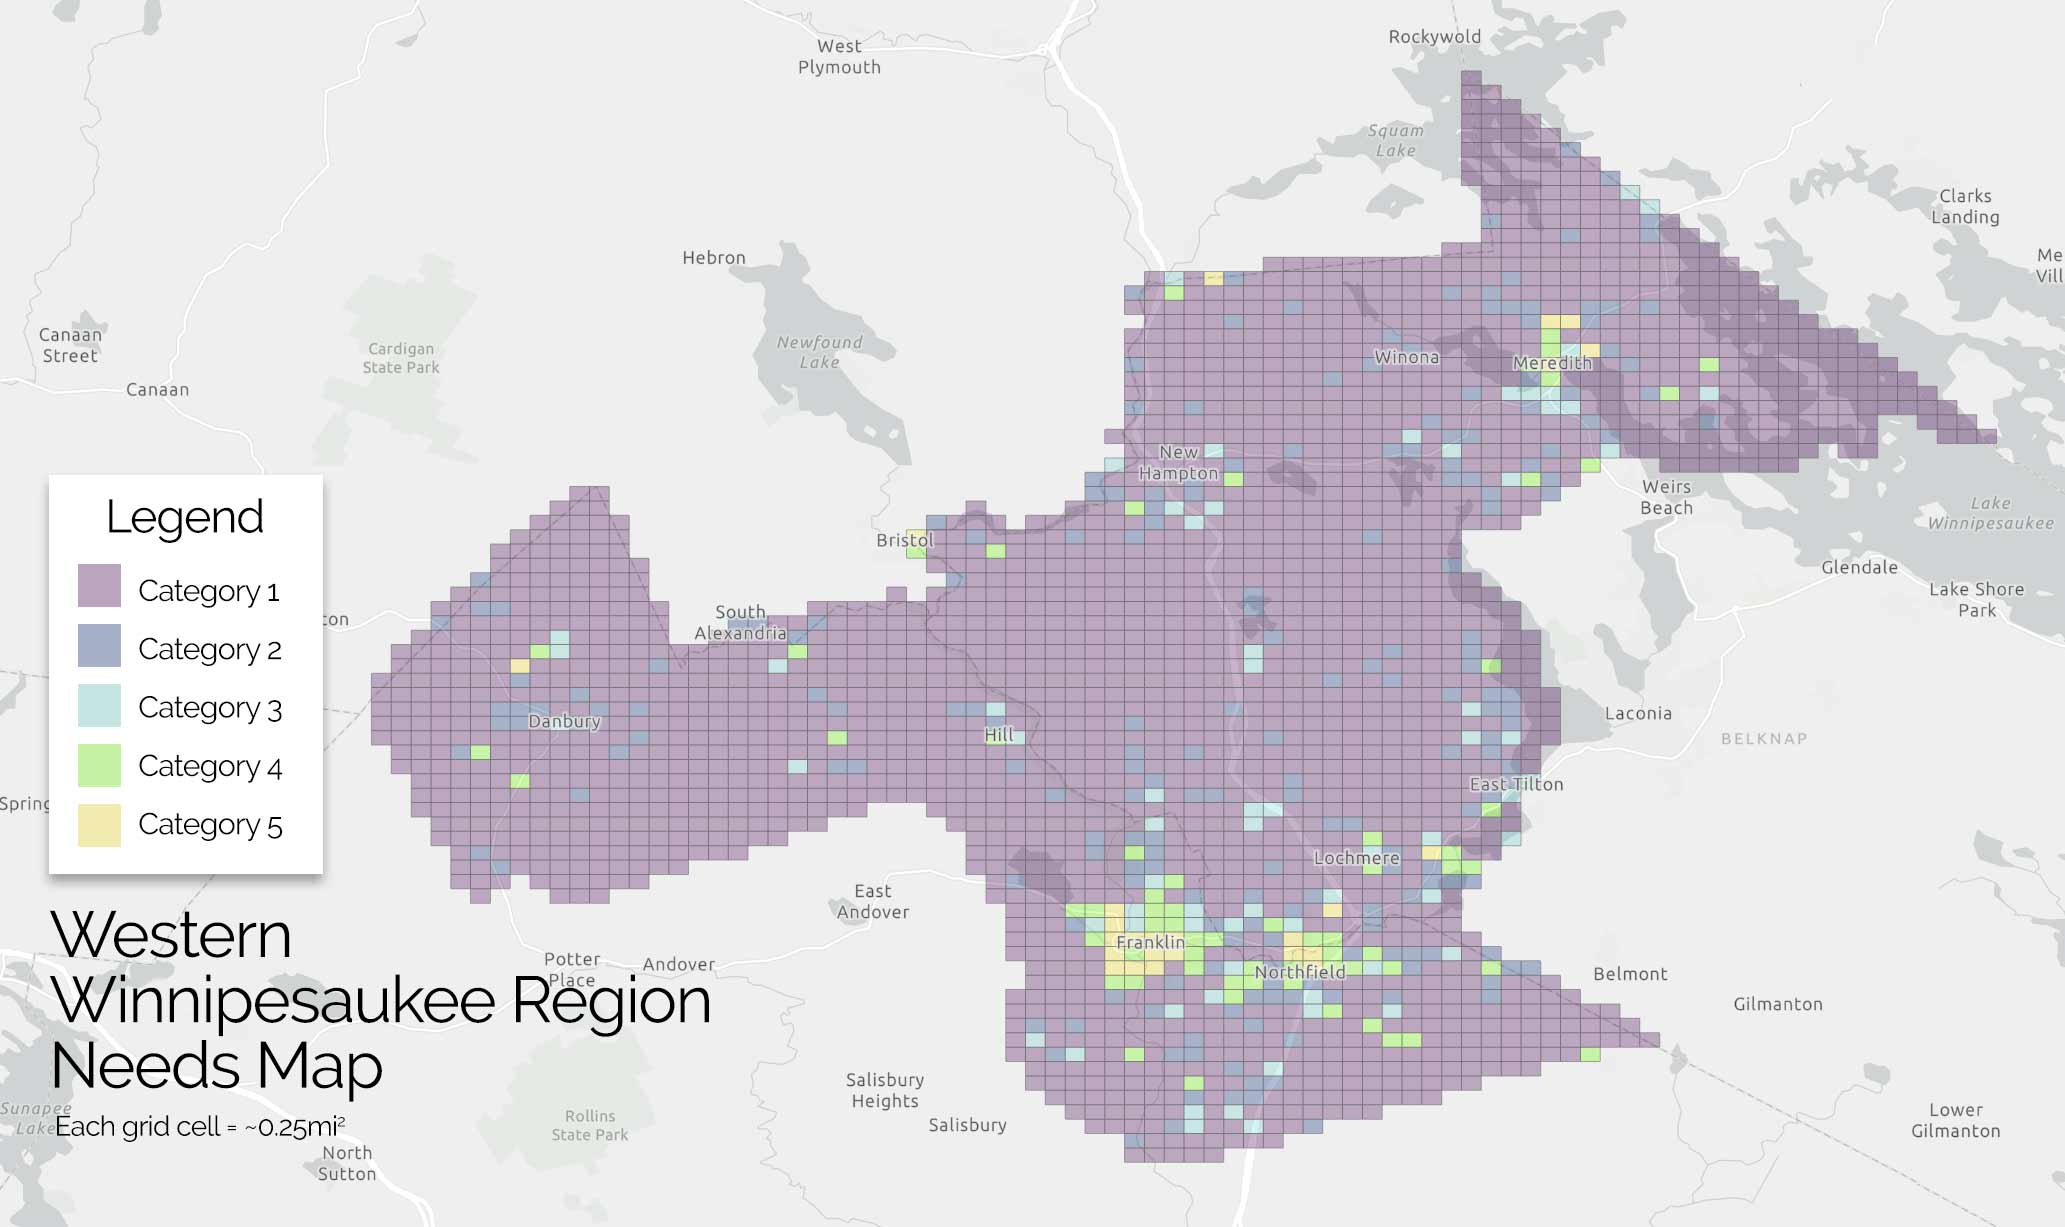
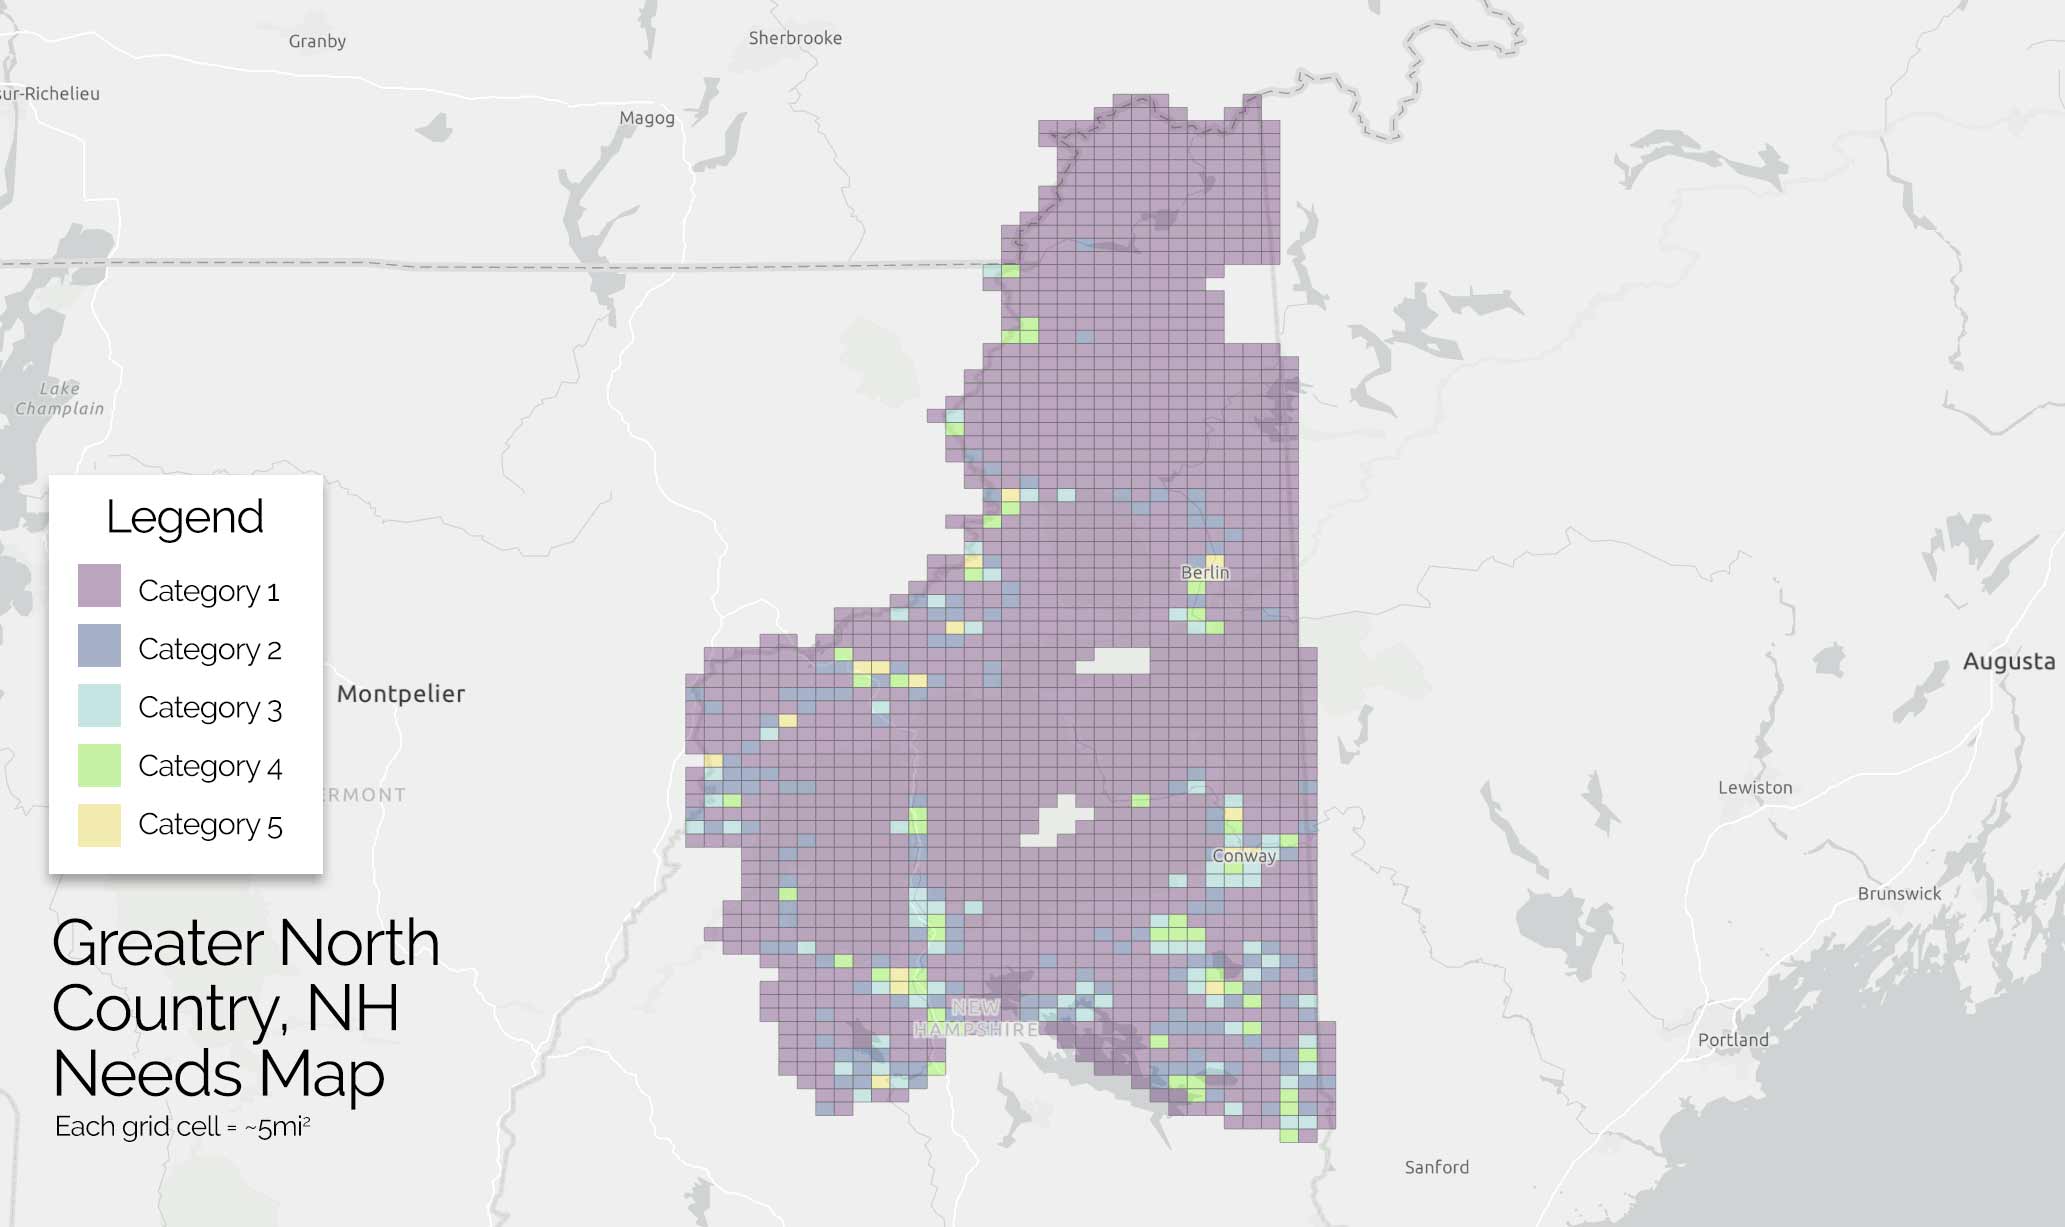
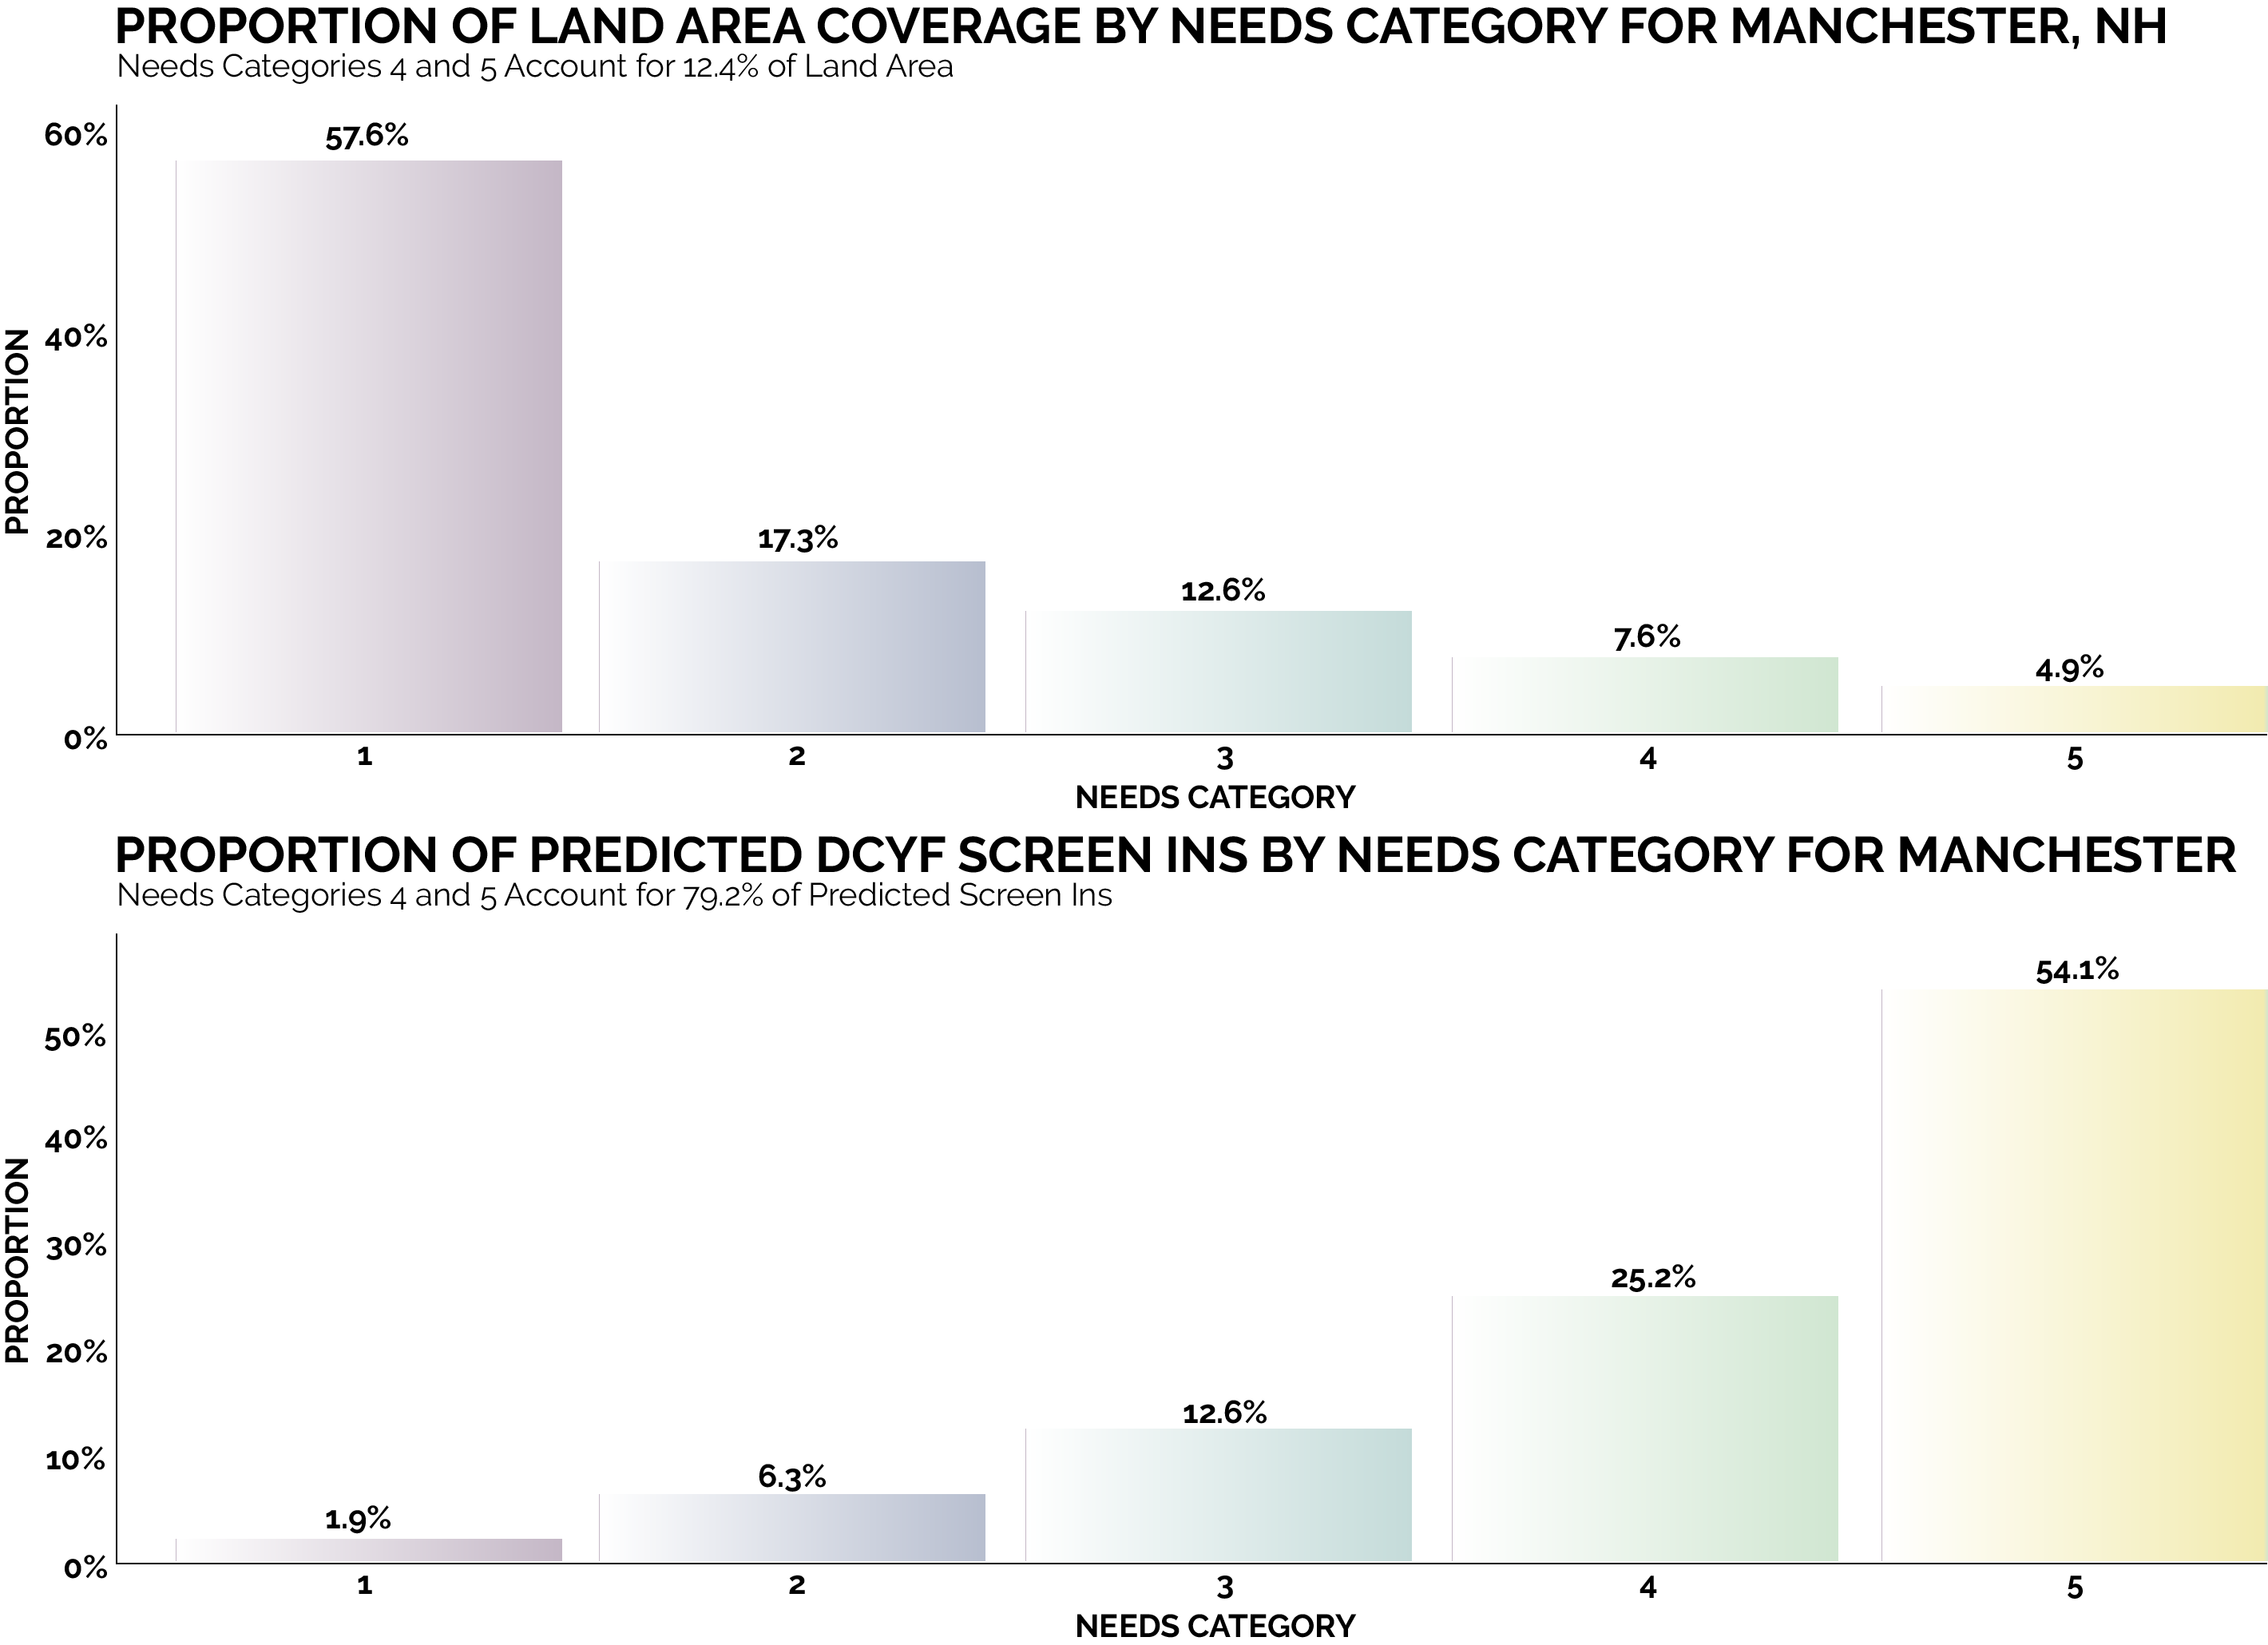
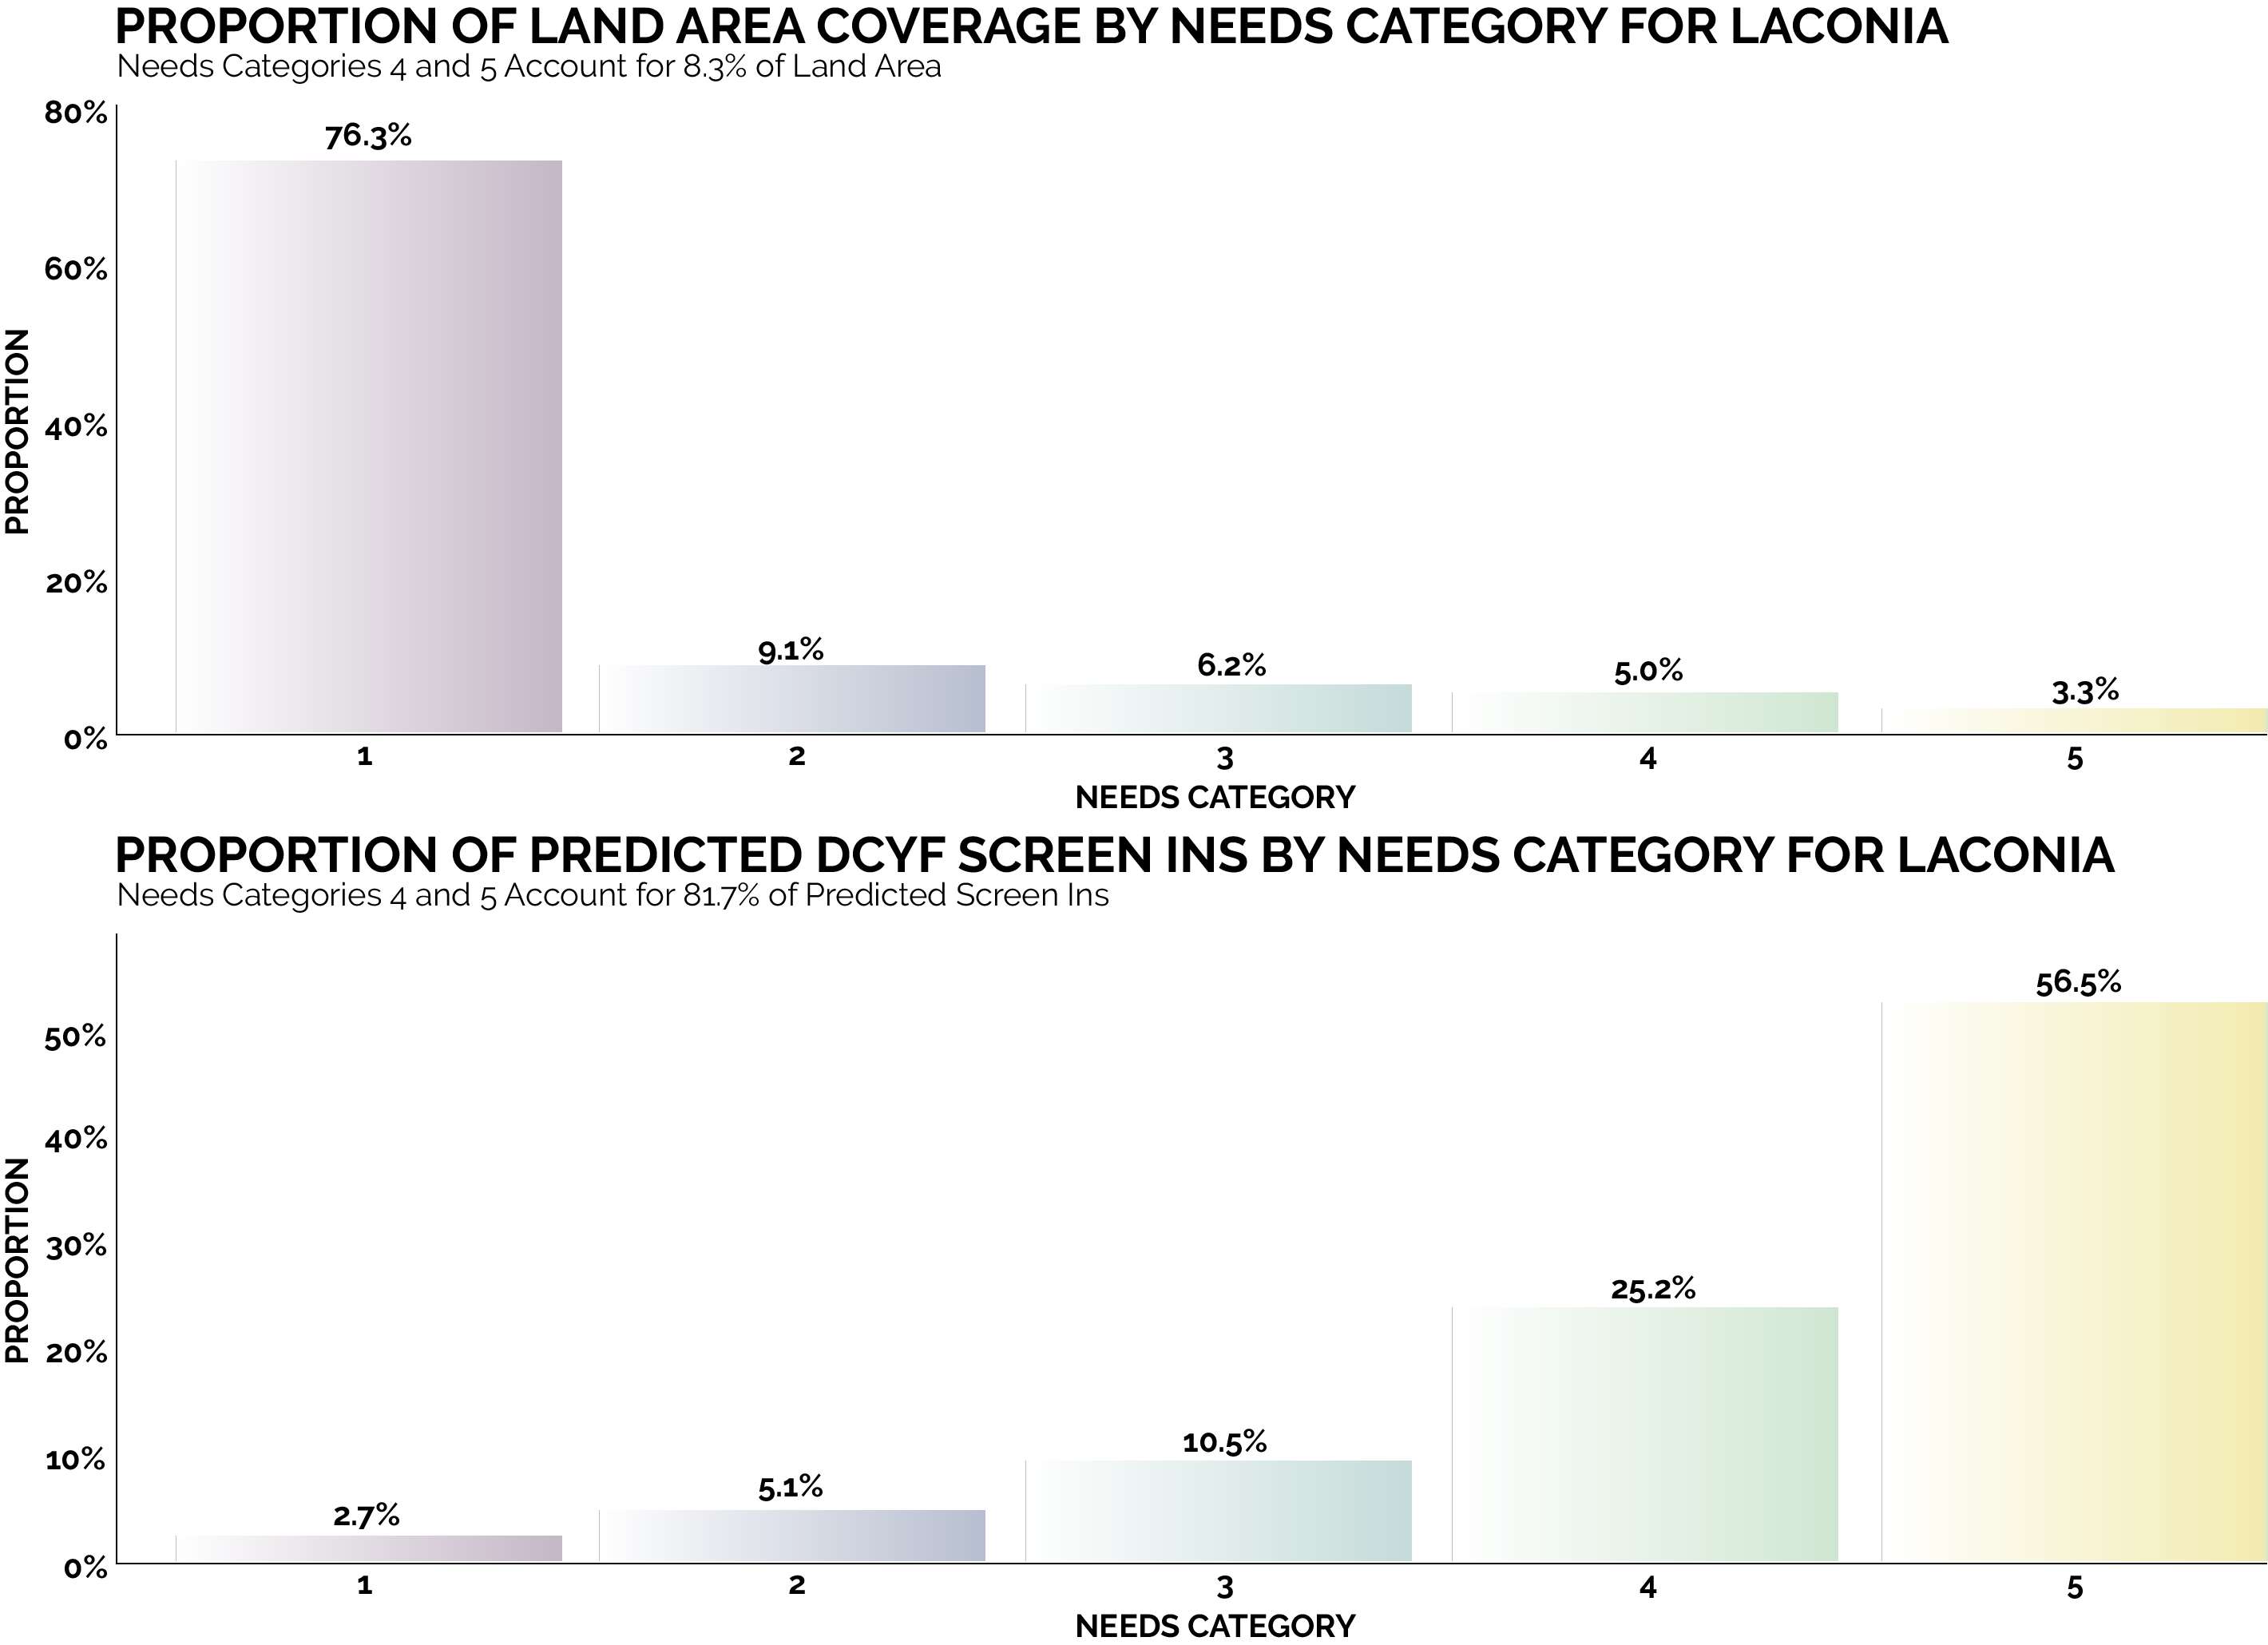
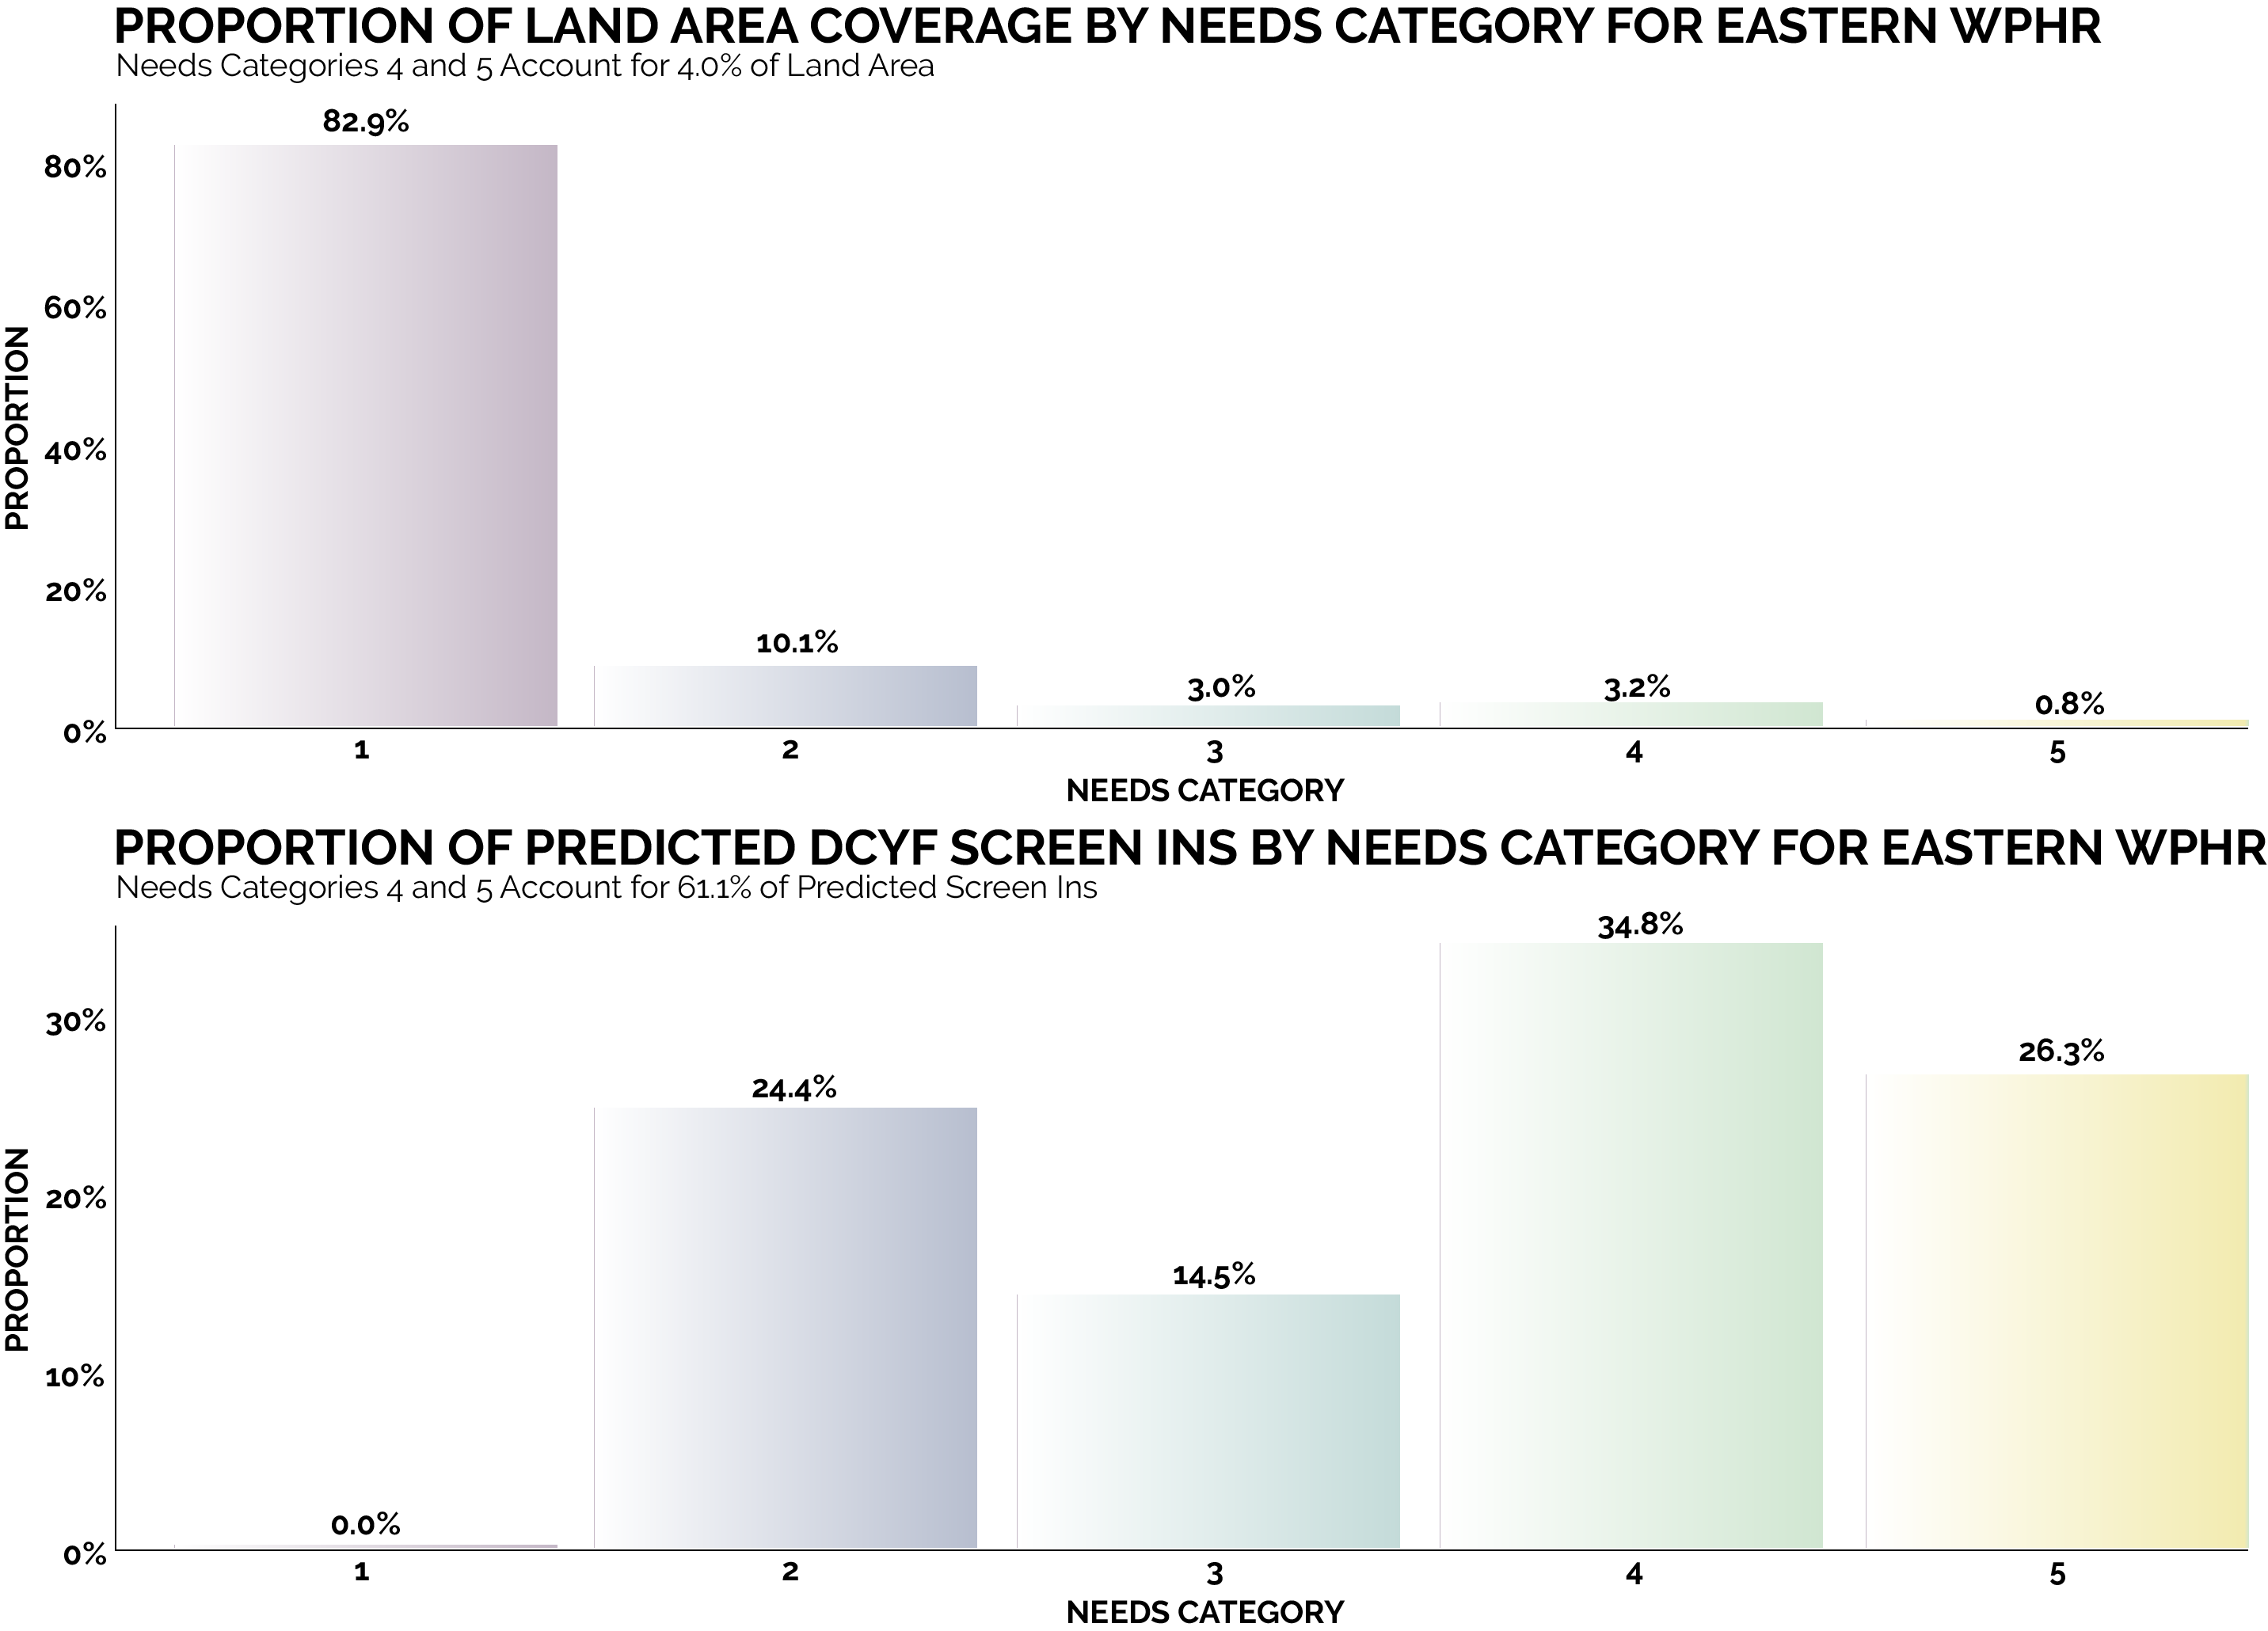
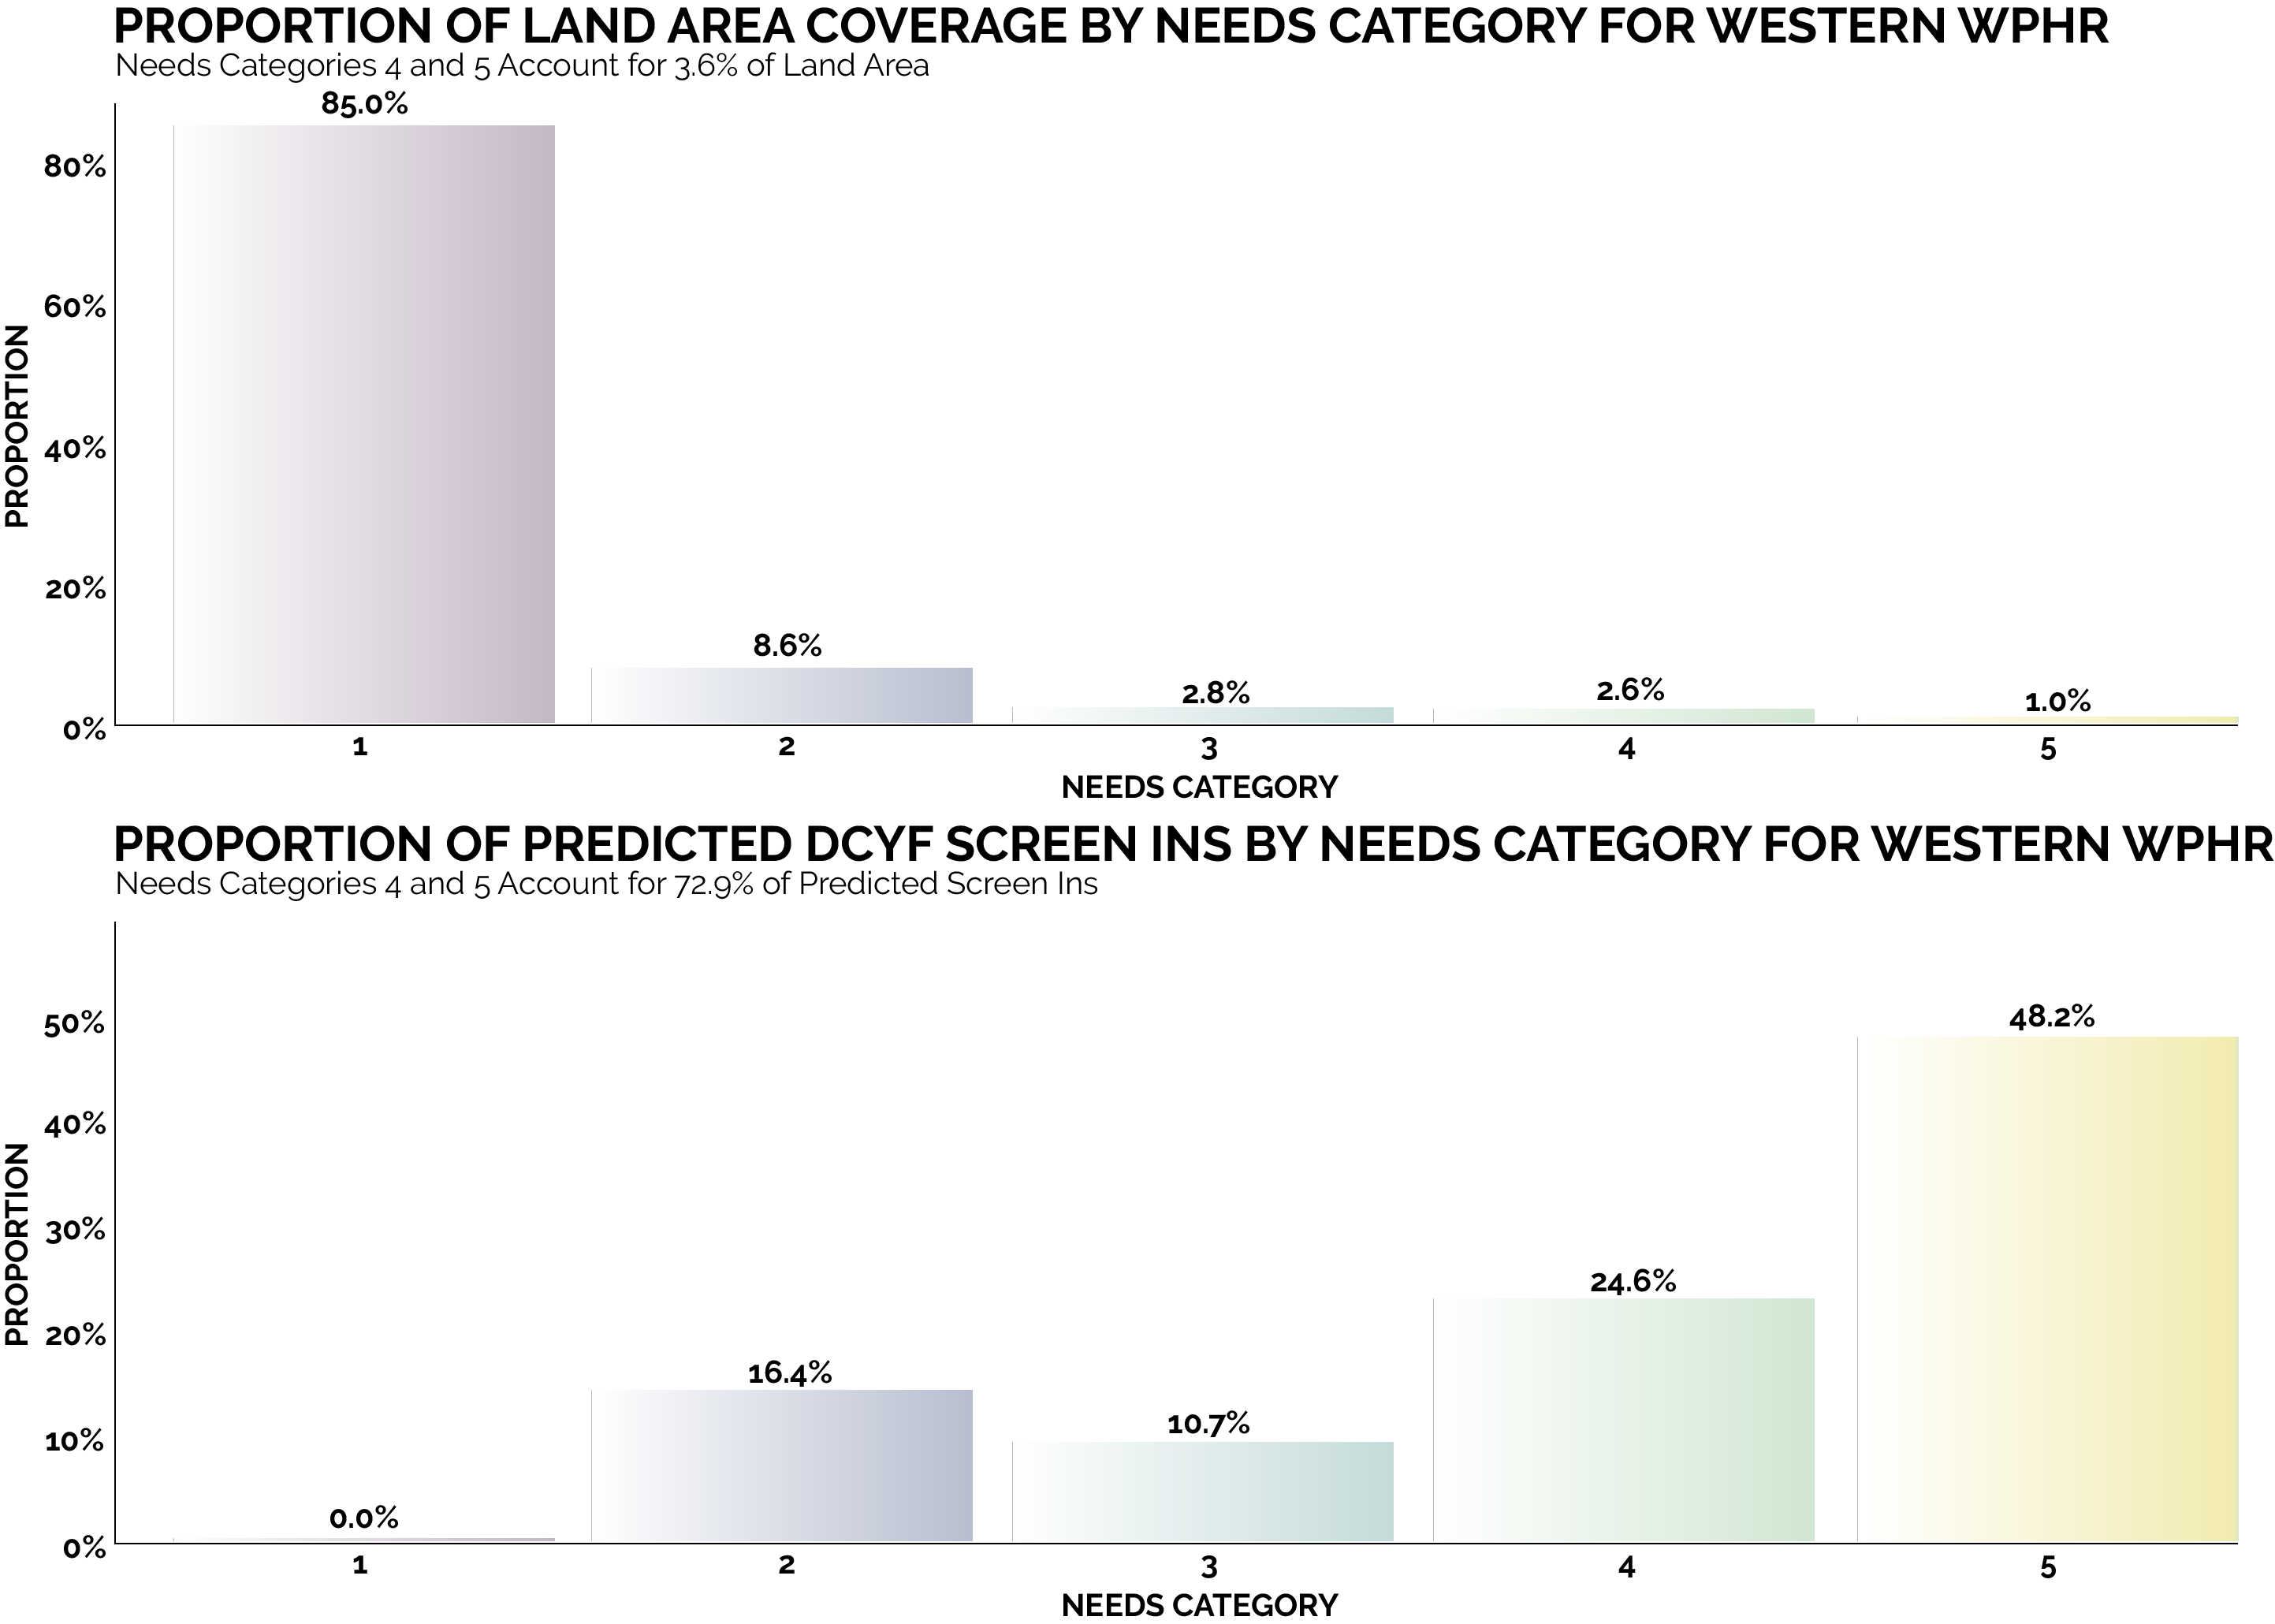
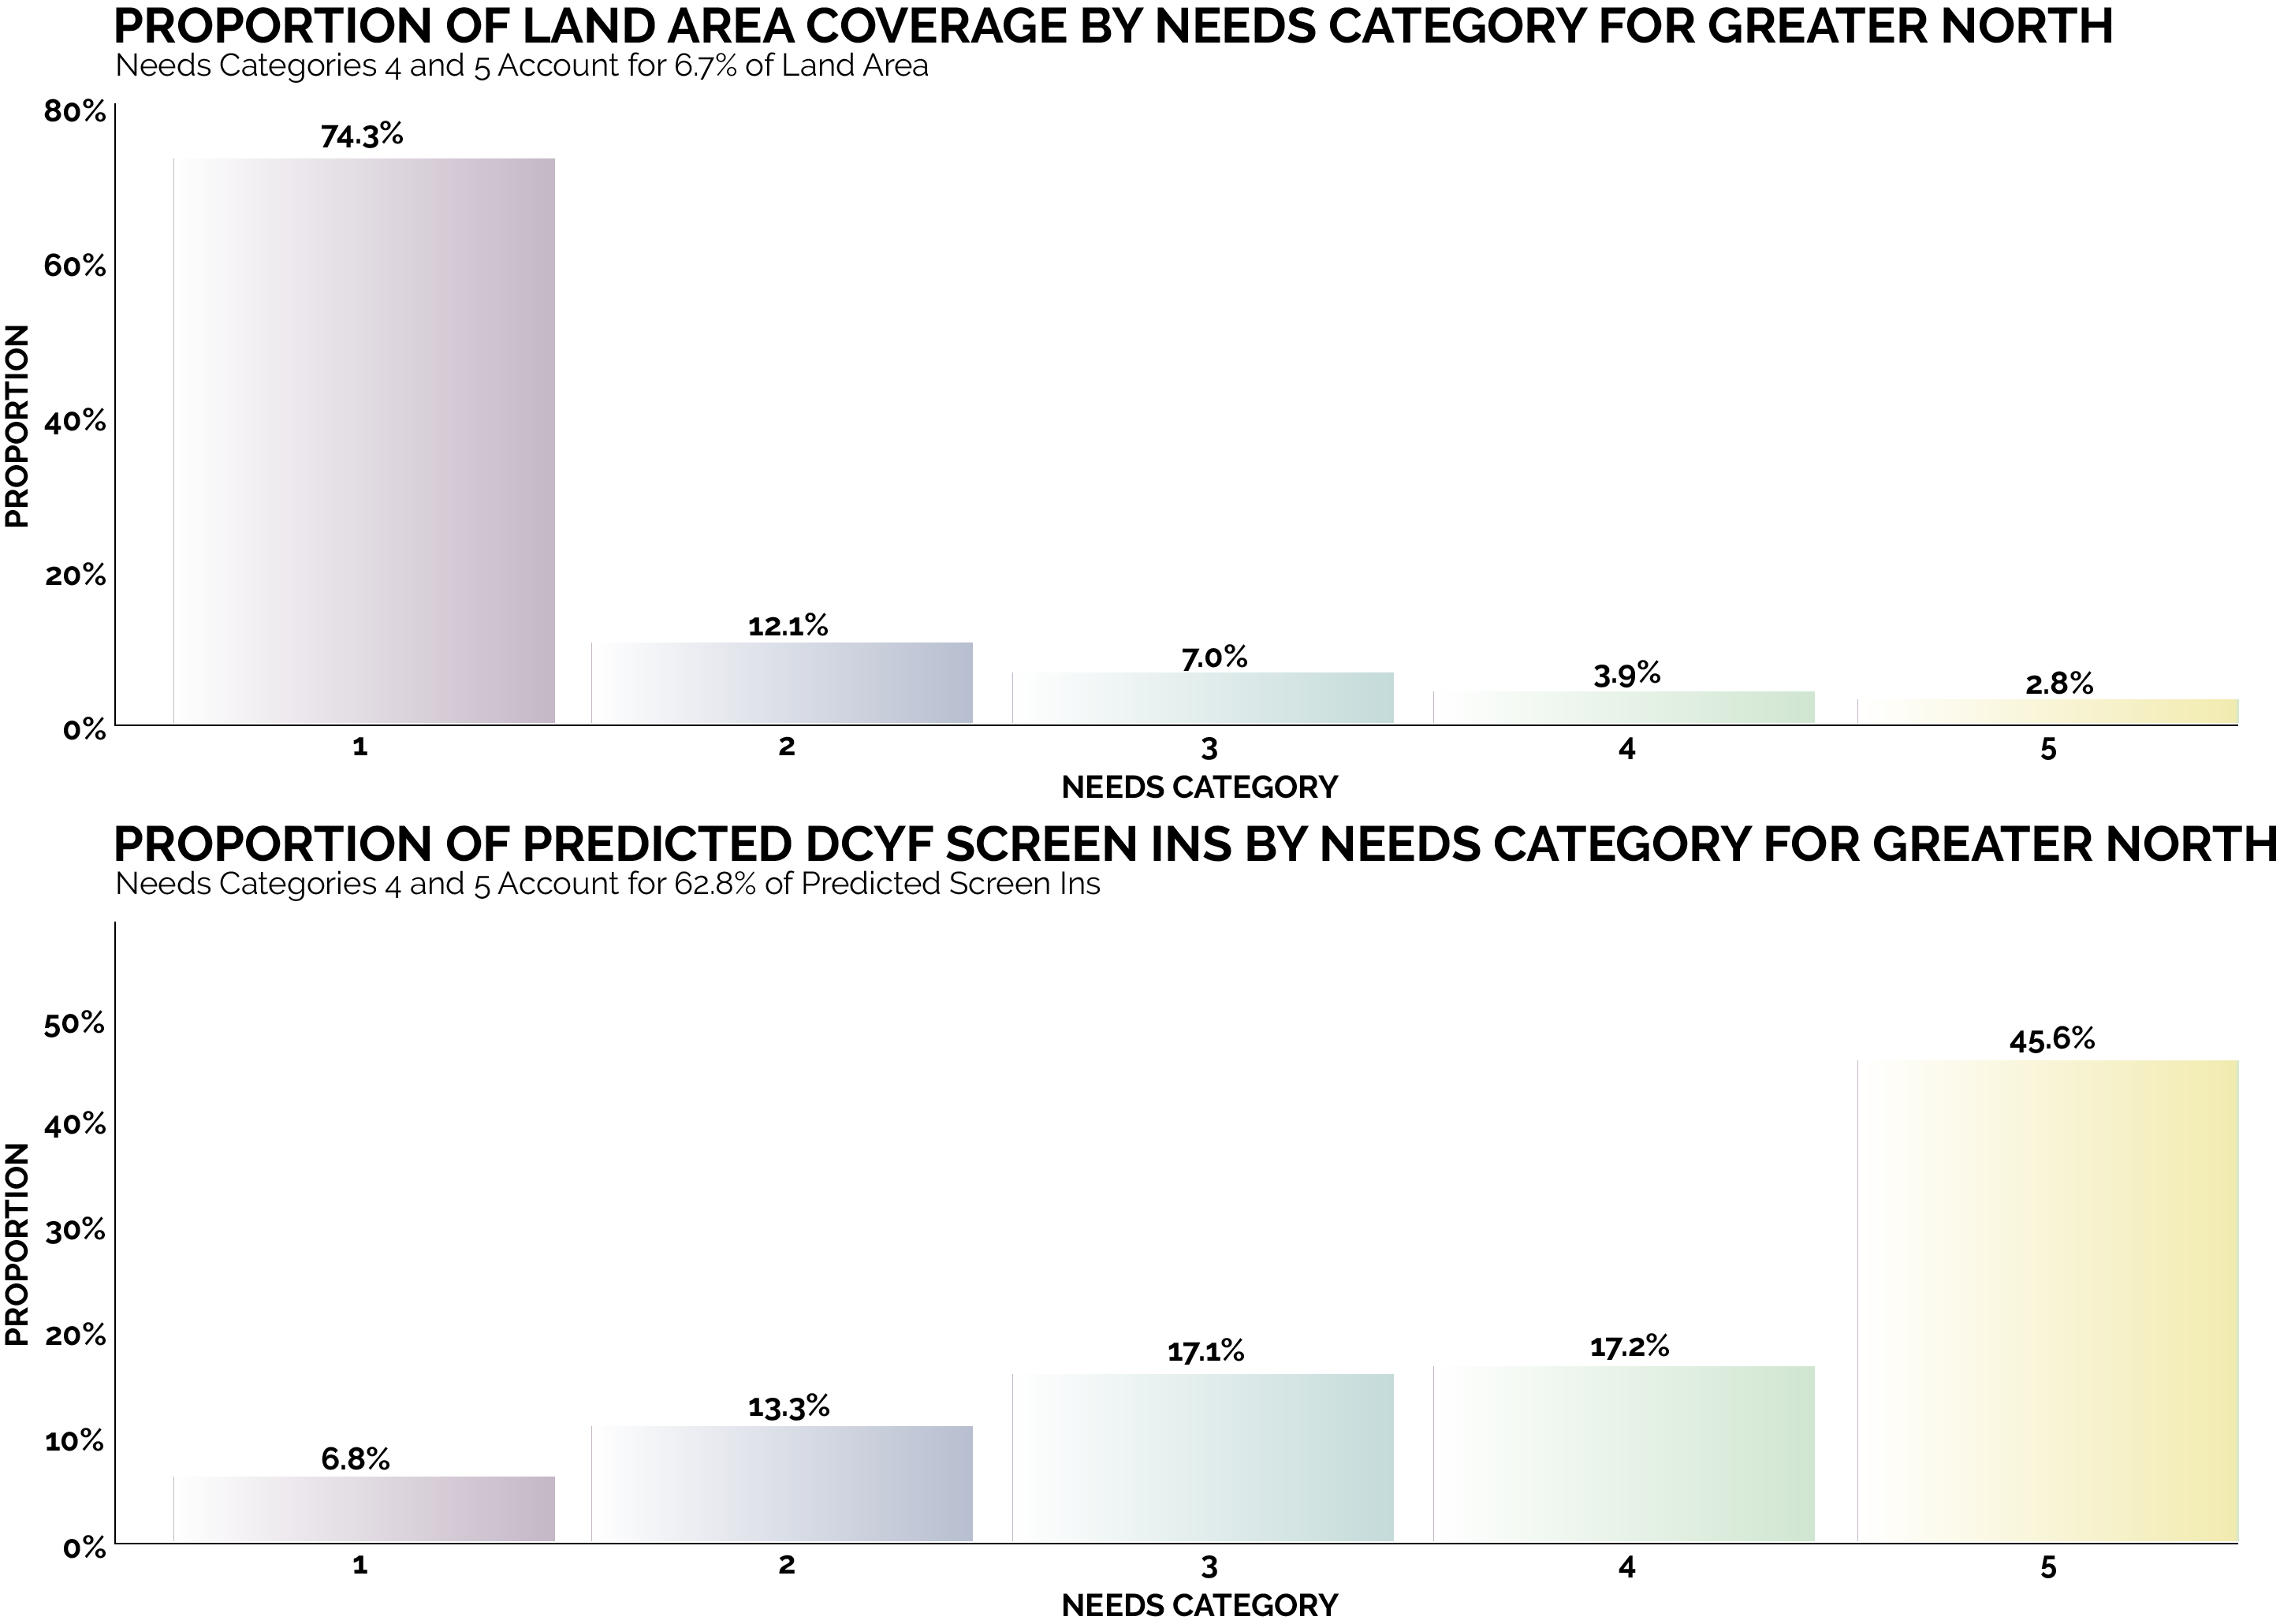
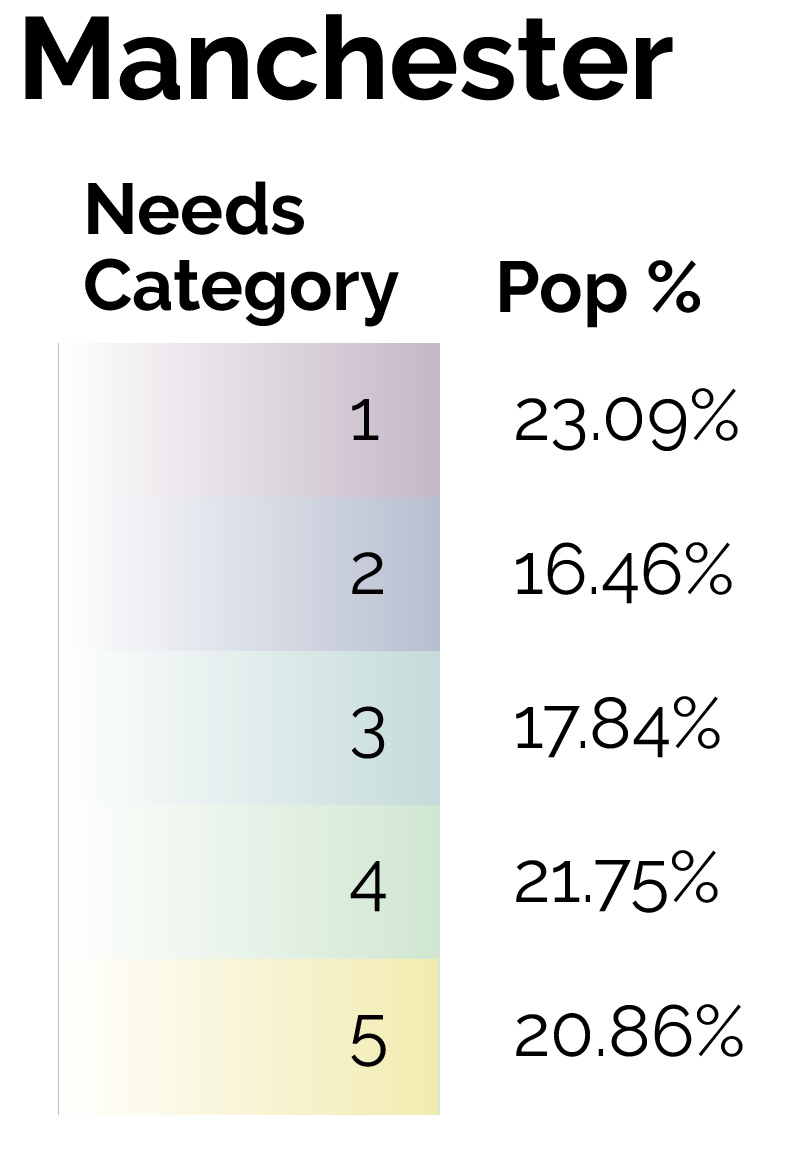
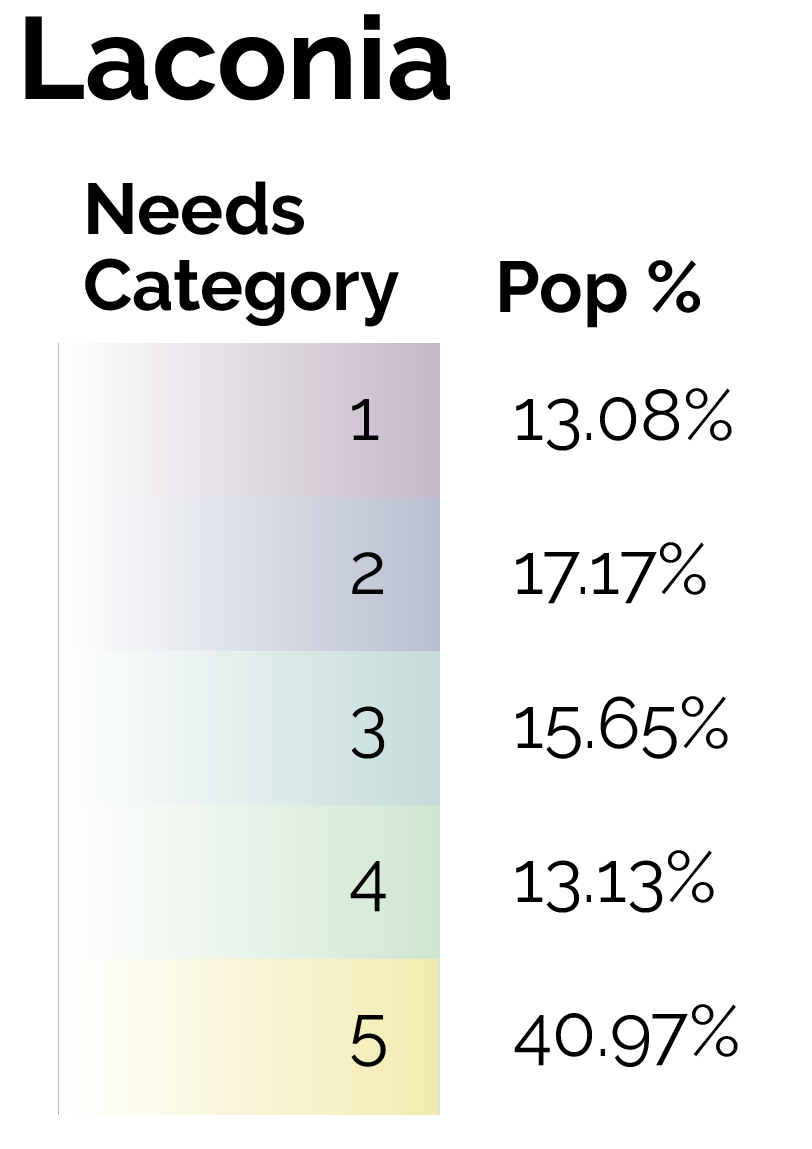
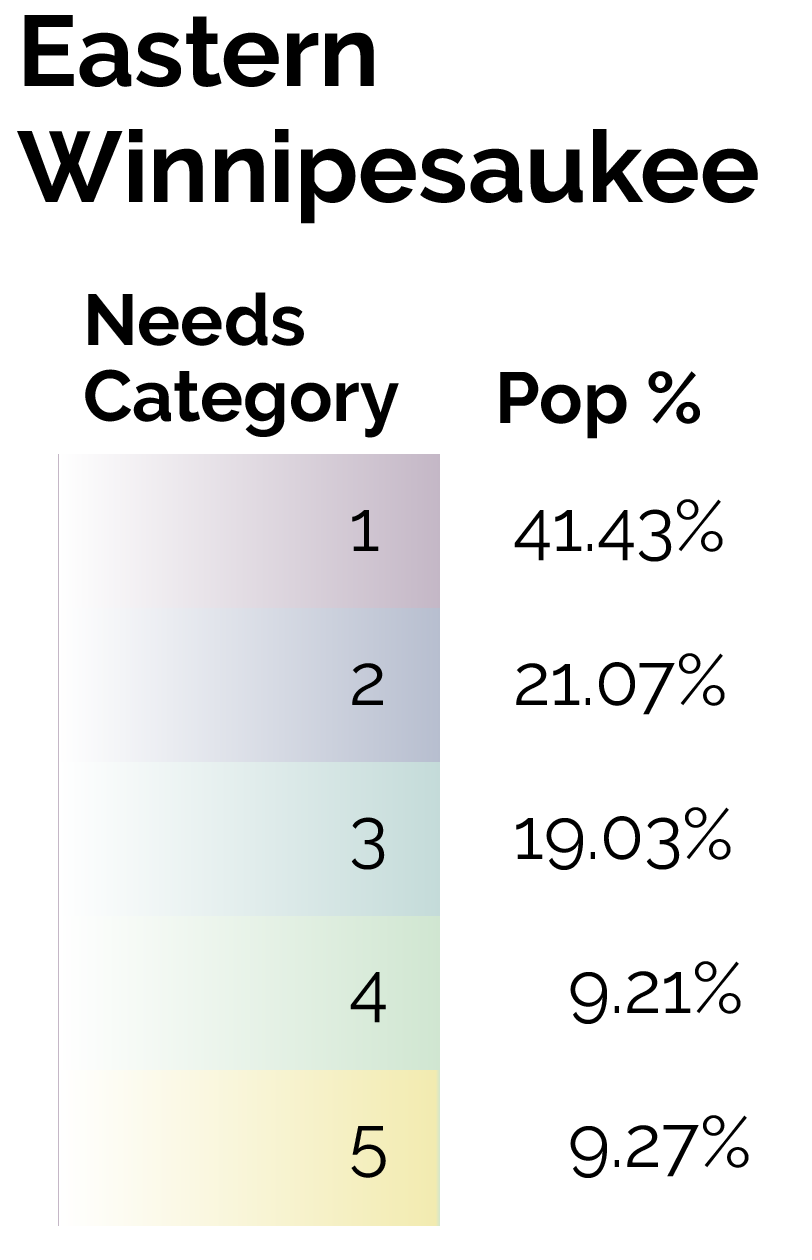
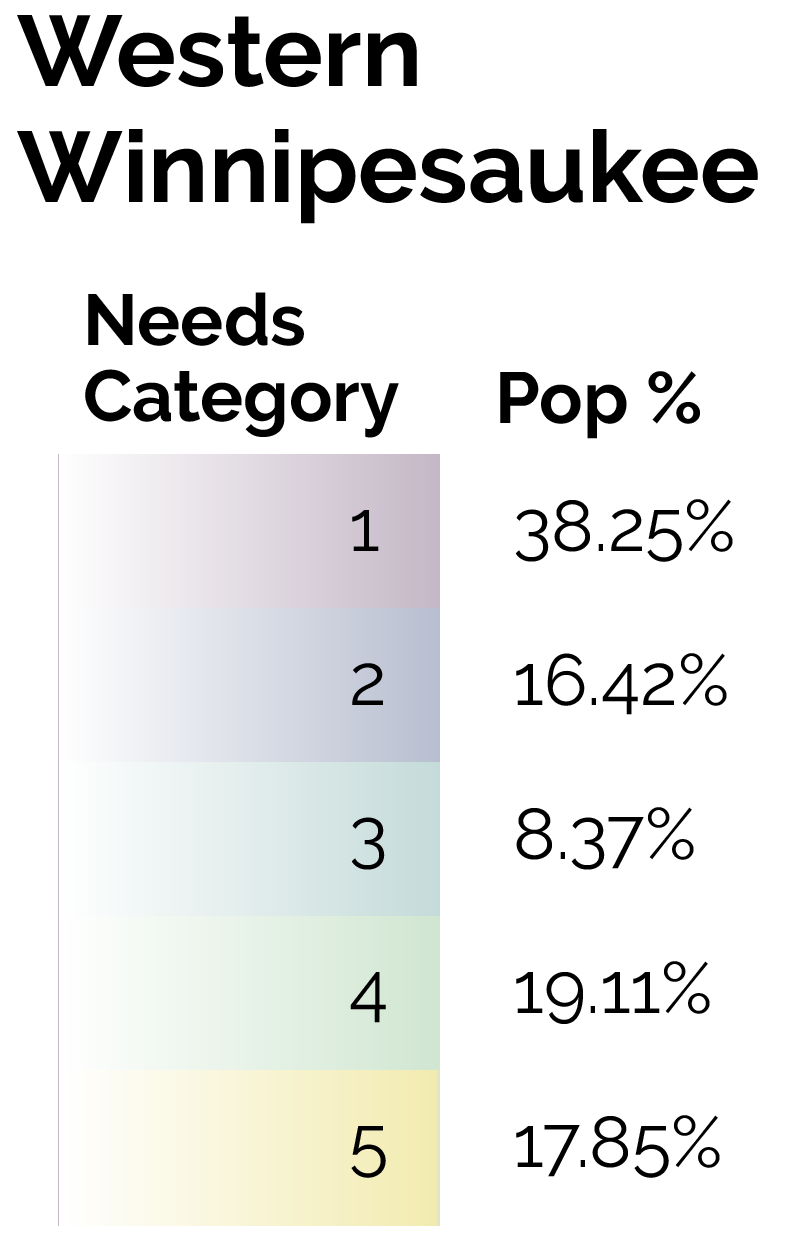
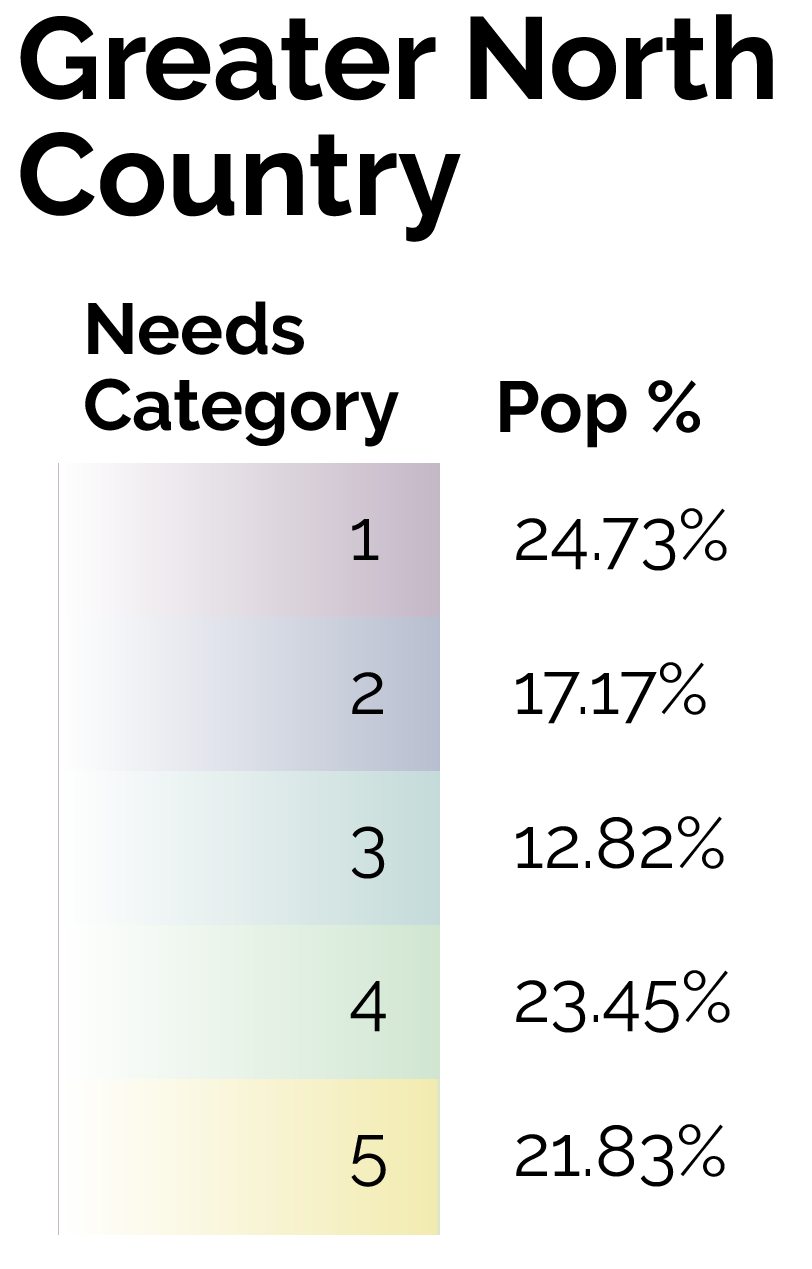
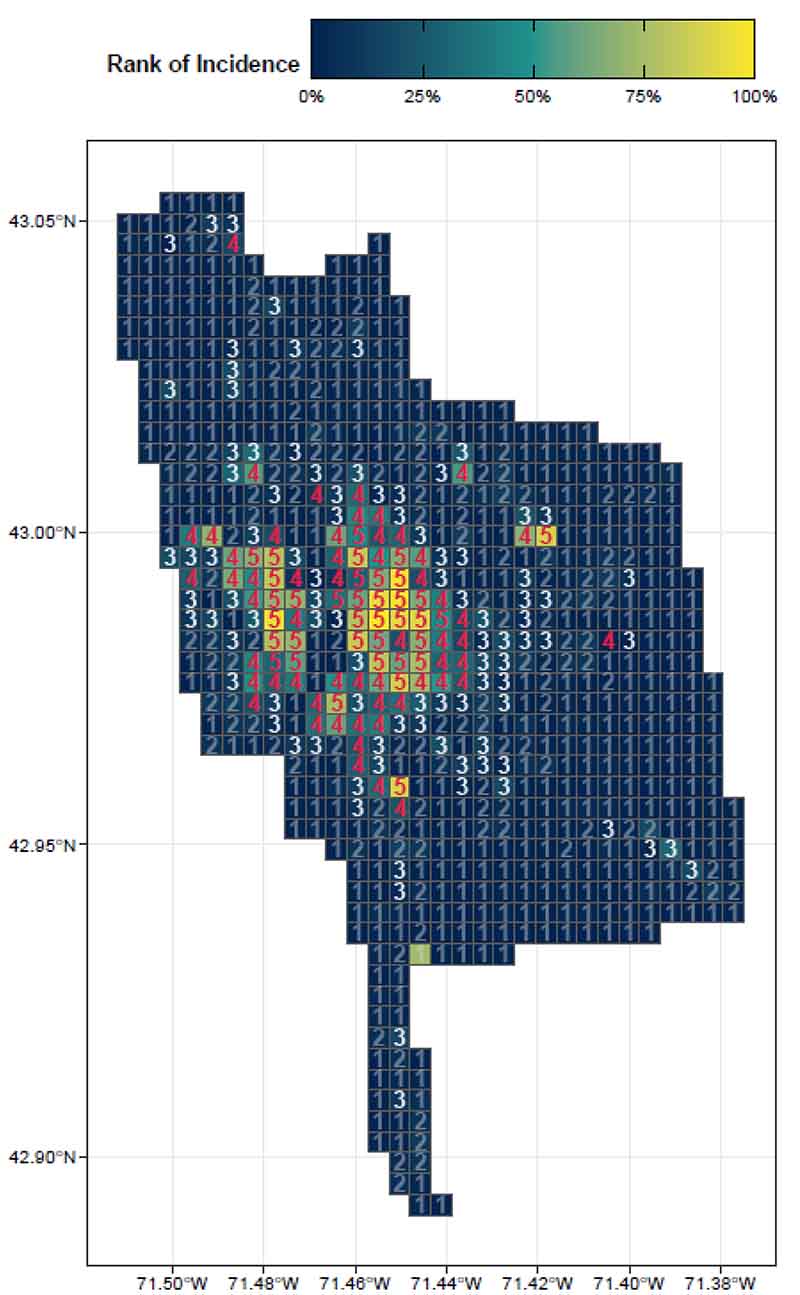
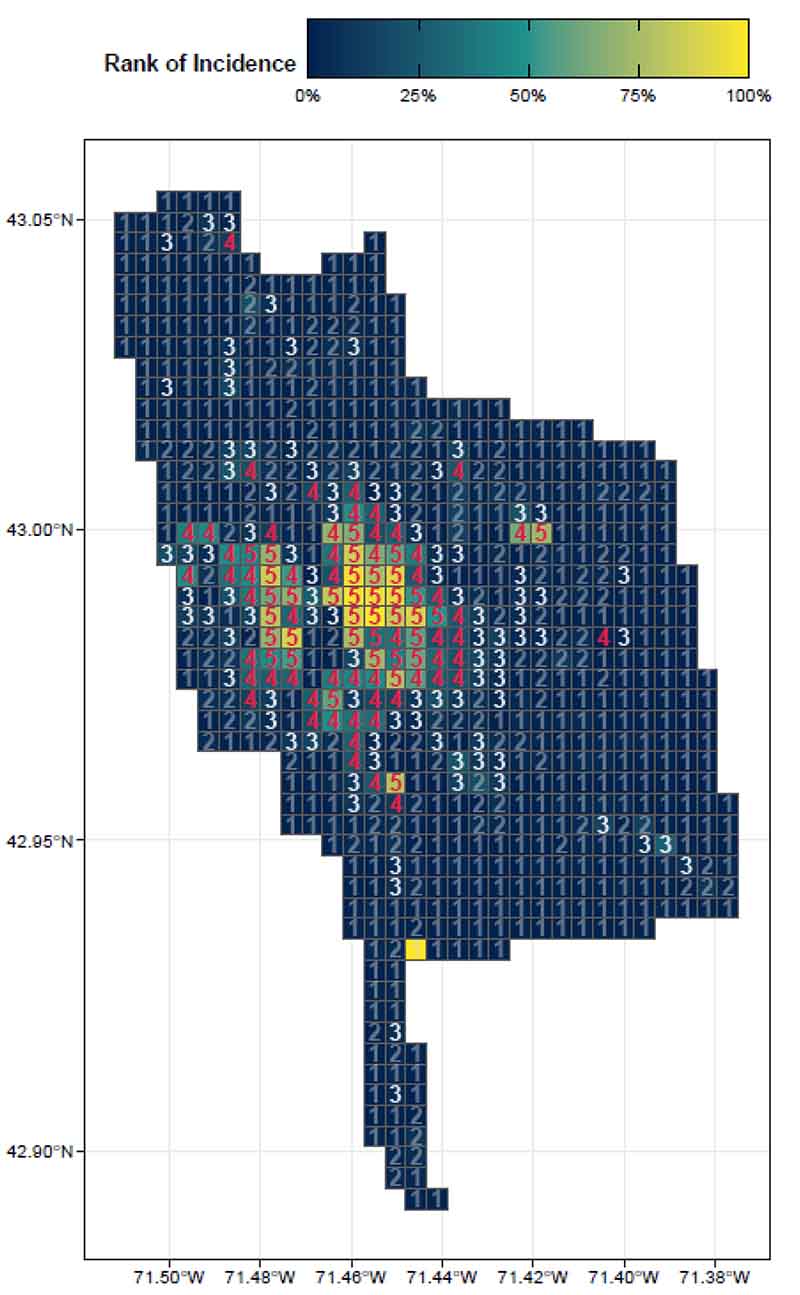
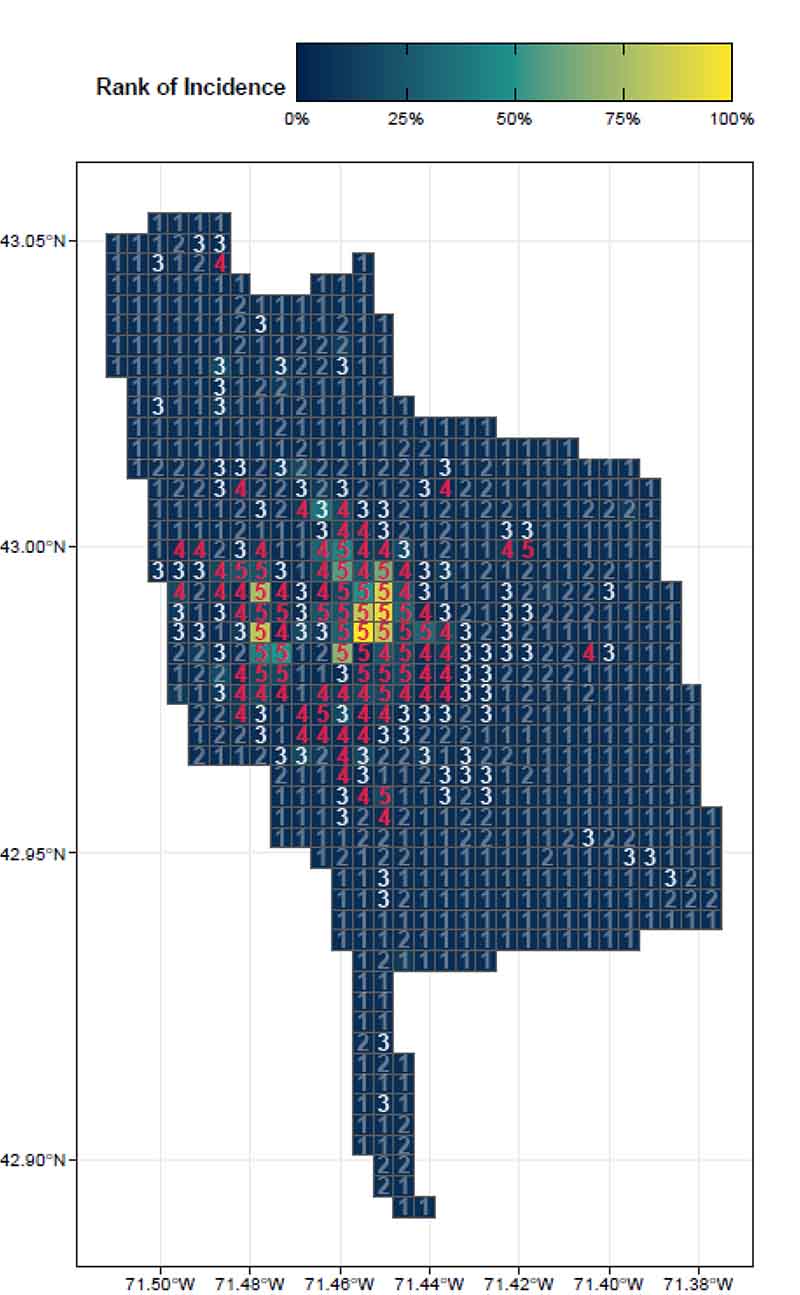
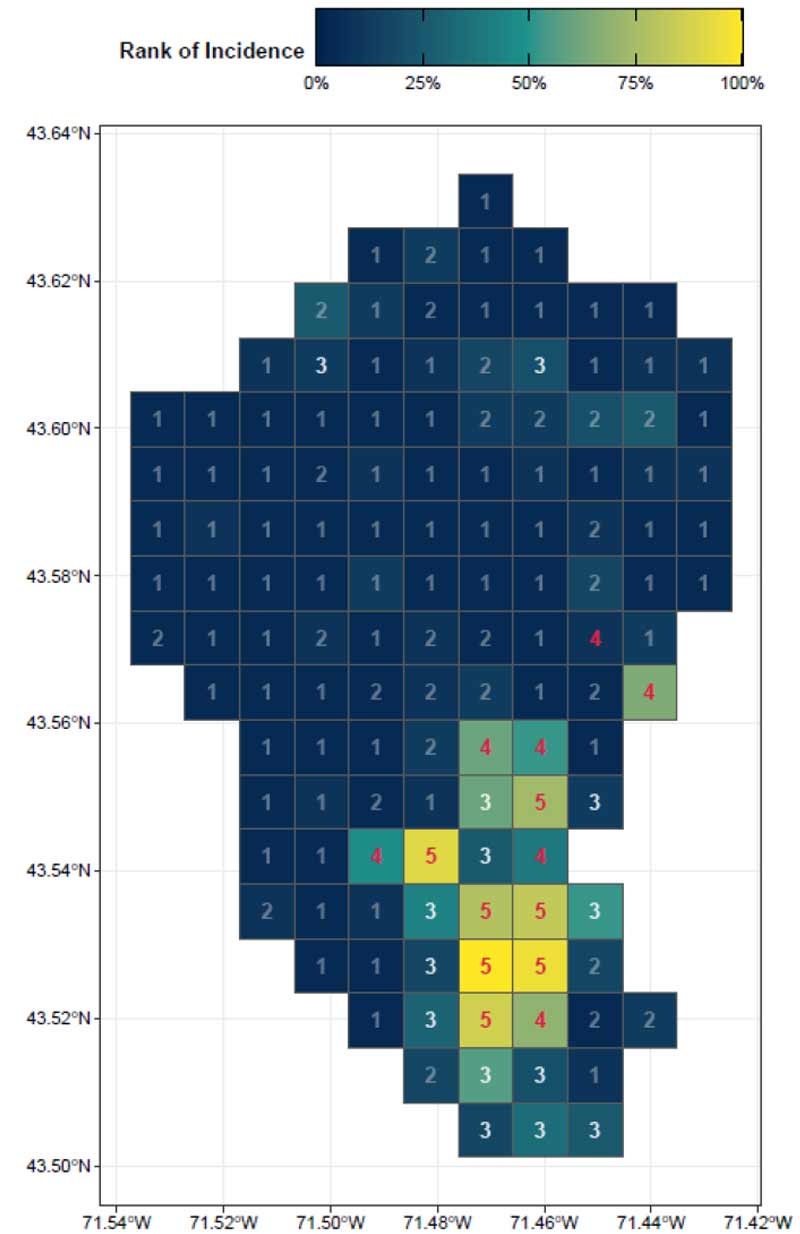
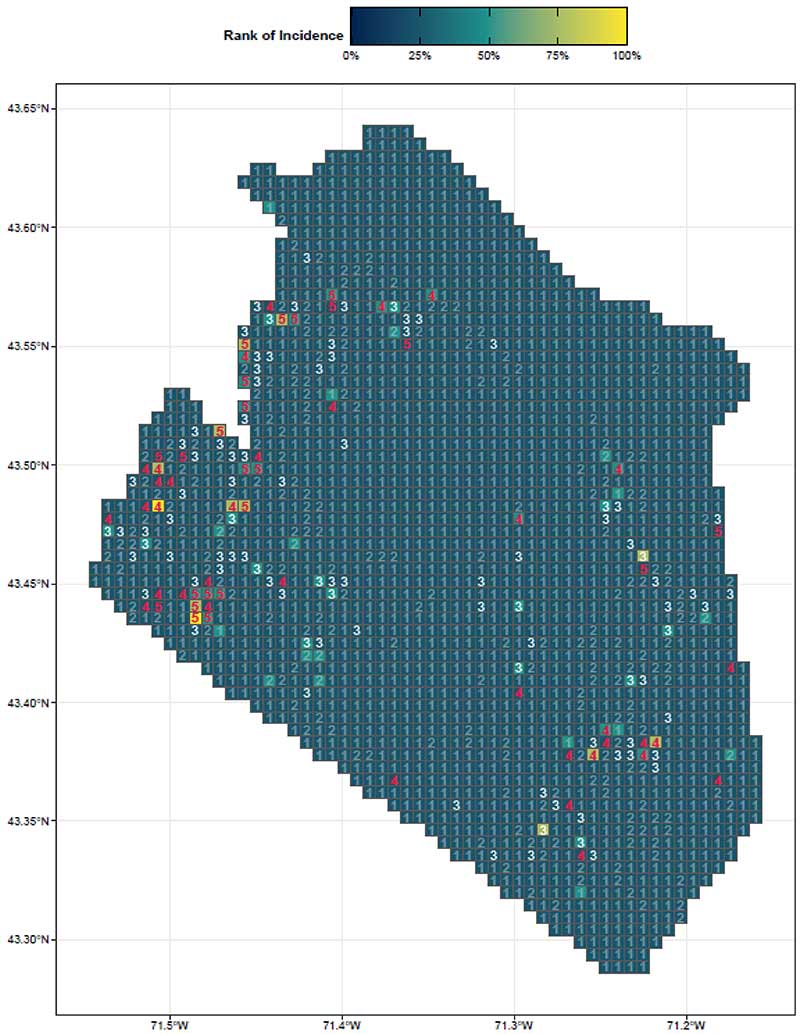
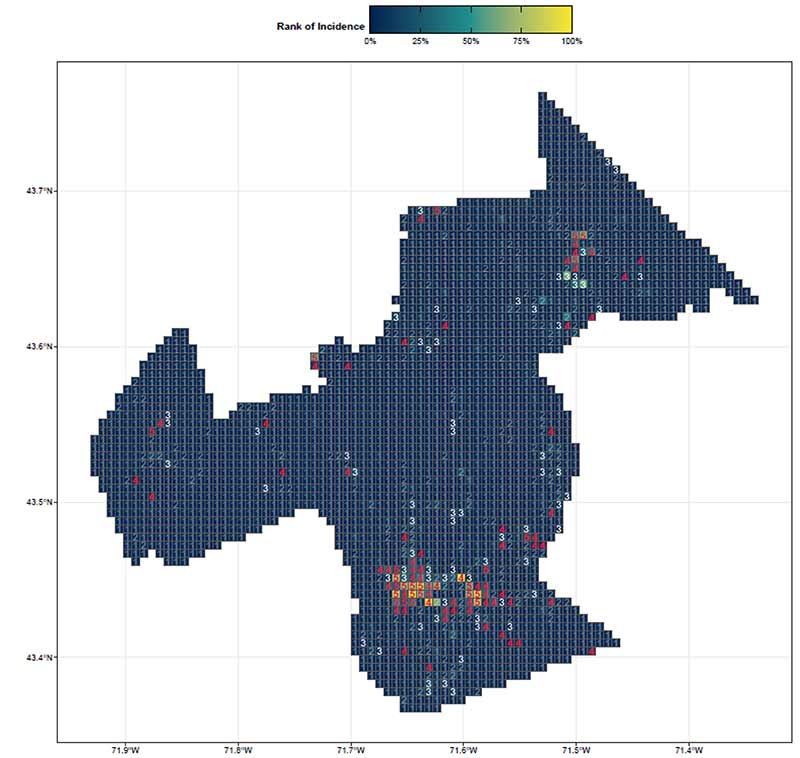
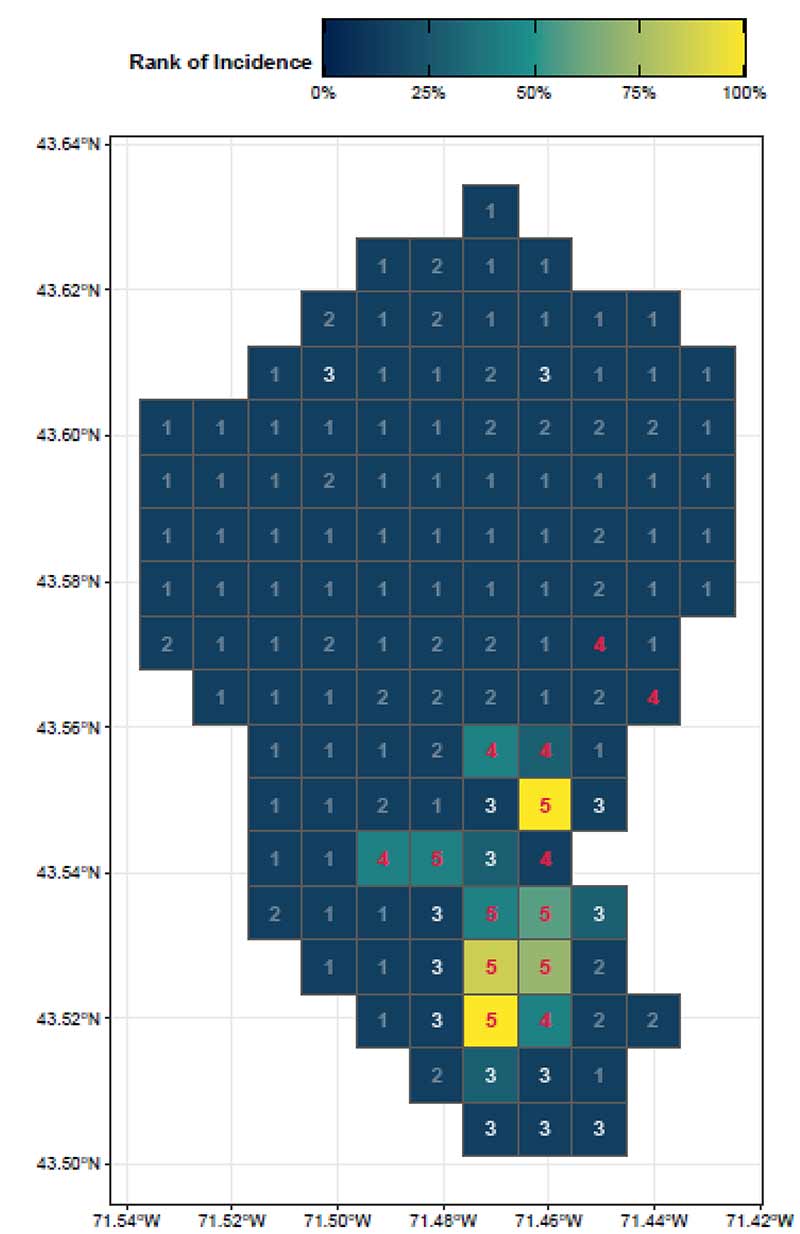
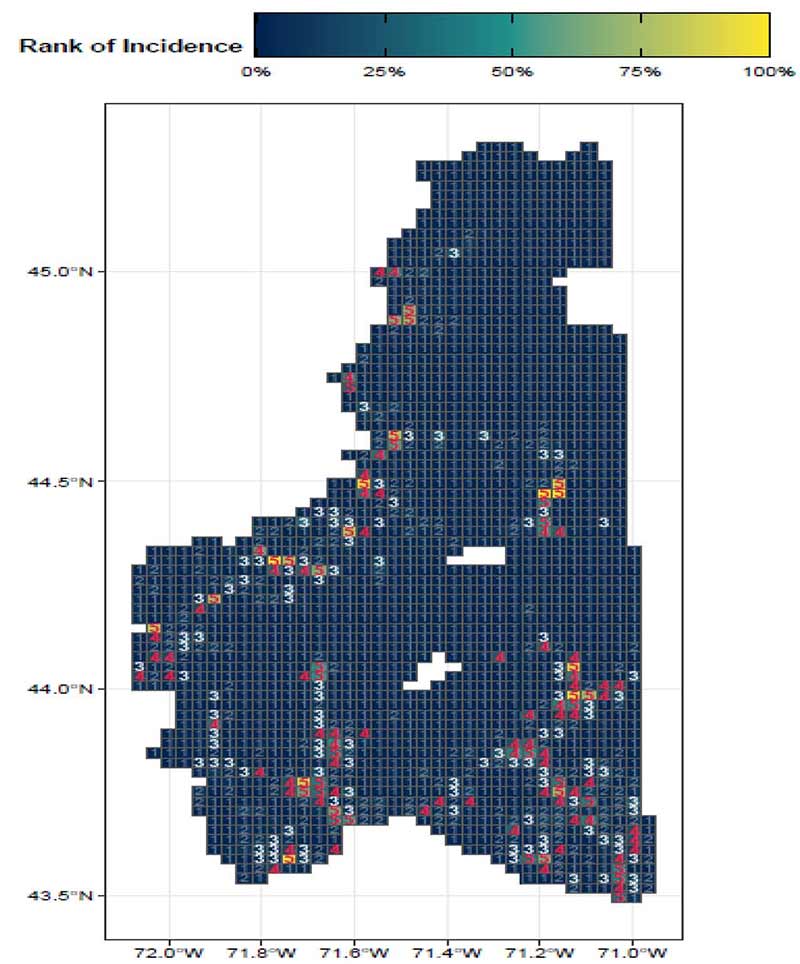
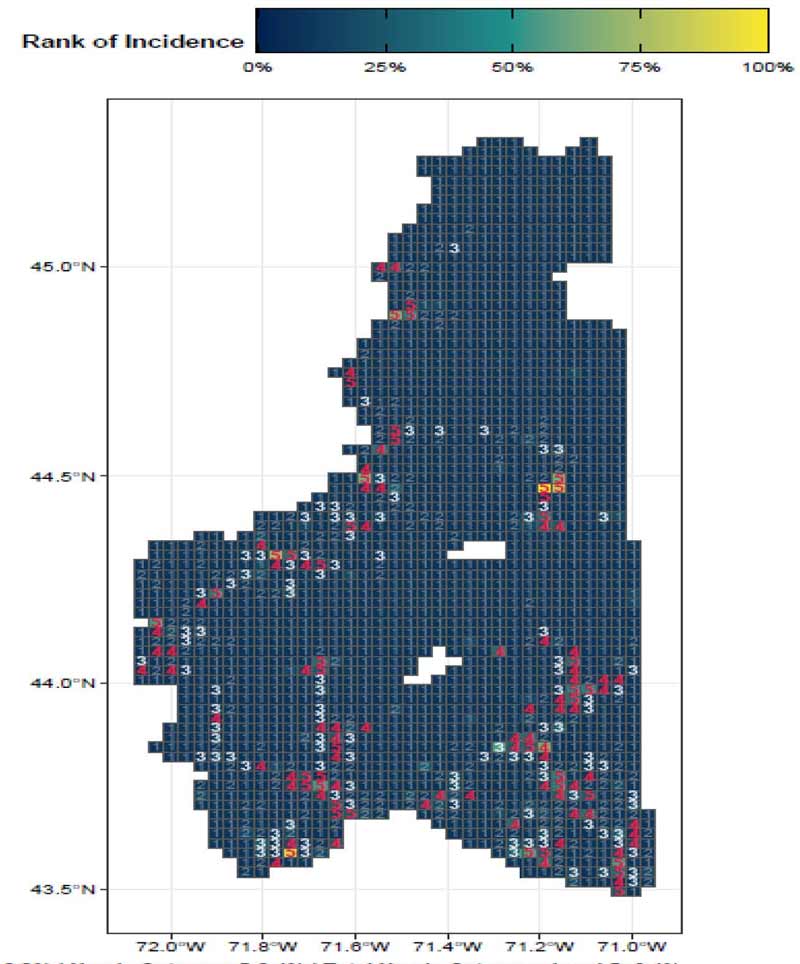
By focusing on this tradeoff, the final predictive model is able to produce highly targeted spatial risk predictions. These risk predictions are split into five risk categories, with five being the greatest risk.

These risk predictions can then be used to evaluate if the availability of child welfare services in a certain region is properly aligned with the demand for these services. This is done by embedding the risk predictions into a strategic planning framework that helps identify resources that are optimally located and can be used to decrease the risk of maltreatment. It is at these locations that stakeholders may wish to deploy education, outreach, and treatment programs.

Needs Maps
by Category

Needs are ranked from Categories 1 through 5, with 5 representing the greatest needs.

Categories 4 and 5 reveal ideal locations for prevention services and the alignment of community resources and supports.

Manchester
Laconia
Eastern
Western
North Country

Proportion of Land Area by Needs Category

The following charts provide further information about Needs Categories. The top bar chart shows the proportion of land area that each category covers. The bottom bar chart shows the proportion of predicted DCYF screened-in reports for each location, by needs category. Screened-in reports are an indicator of child maltreatment and the dependent variable for the analysis.

Category 5 accounts for a small percentage of the land area but has the greatest burden of external stressors. With this information, precisely targeted prevention can be deployed across a serviceable area, leveraging limited resources.

Manchester

Manchester

Laconia

Laconia

Eastern Winnipesaukee

Eastern

Western Winnipesaukee

Western

Greater North Country

Greater North

Population Count
by Needs Category

The following tables depict the ambient averaged population counts (volume of people in a particular location throughout the day) per Needs Category.

Ambient population statistics were chosen to more accurately represent population count at the grid cell level. This information allows for detailed prevention planning.

Risk Factors for Highest Needs Areas

The following include top risk factors identified from hundreds of variables in each of the study areas. These factors can lead to outcomes such as: child maltreatment, health conditions, and delinquency, among many others.

Our efforts can now focus on collaborating with resources to implement preventive and supportive services targeted for each community.

Manchester

  • Diabetes
  • Lead Exposure
  • Drug Abuse/Overdose/Sale & Manufacturing
  • Drug Abuse During Pregnancy
  • Assault / Community Violence
  • Neonatal Abstinence Syndrome
  • Urinary Tract Infection
  • Asthma or Chronic Obstructive Pulmonary Disease

Laconia

  • Diabetes
  • Neonatal Abstinence Syndrome
  • Lead Exposure
  • Self Harm
  • Asthma or Chronic Obstructive Pulmonary Disease
  • Assault / Community Violence
  • Drug and Alcohol Abuse During Pregnancy
  • Drug and Alcohol Abuse
  • Urinary Tract Infection

Eastern Winnipesaukee Region

  • Assault / Community Violence
  • Diabetes
  • Urinary Tract Infection
  • Asthma or Chronic Obstructive Pulmonary Disease
  • Alcohol Abuse
  • Self Harm
  • Lead Exposure

Western Winnipesaukee Region

  • Drug Abuse
  • Drug and Alcohol Abuse During Pregnancy
  • Lead Exposure
  • Neonatal Abstinence Syndrome
  • Assault / Community Violence
  • Diabetes
  • Asthma or Chronic Obstructive Pulmonary Disease
  • Urinary Tract Infection

Greater North Country

  • Diabetes
  • Lead Exposure
  • Asthma or Chronic Obstructive Pulmonary Disease
  • Drug Abuse During Pregnancy
  • Neonatal Abstinence Syndrome
  • Self Harm
  • Drug Abuse

Social Determinants of Health

Social determinants of health (SDOH) are the conditions in the environments where people are born, live, learn, work, play, worship, and age that affect a wide range of health, functioning, and quality-of-life outcomes and risks.[1]

A variety of minesweeper maps were created to provide further insight into the Needs Assessment Maps, categorizing by SDOH domain. The following are examples from each of the study areas.

Needs Maps

The numbers in each grid cell show the Need Category for that area, with categories 4 and 5, depicted in red text, having the greatest need of resources and services.

The color of the grid cell shows the proportion of the given indicator in this area, the more yellow the grid cell, the higher the burden of the indicator.

Indicators where the yellow grid cells align with categories 4 and 5 reveal specific risks and needs of the neighborhoods.
Maps Courtesy DHHS

Manchester

Downtown Manchester

Children’s Medicaid

Supplemental Nutrition Assistance Program - Food Stamps

Lead Exposure - Children Tested with Lead Elevations

Winnipesaukee Region

Laconia: Children’s Medicaid

Eastern Winnipesaukee: Child Care Assistance

Western Winnipesaukee: Hospital ED Visits - Prevention Quality Indicators - Asthma or Chronic Obstructive

Laconia: Lead Exposure, Children Tested with Lead Elevations

Greater North Country

Supplemental Nutrition Assistance Program - Food Stamps

Child Care Assistance

Lead Exposure - Children Tested with Lead Elevations

Click to Continue to Psychographic Segmentation Section

References

Visit www.Predict-Align-Prevent.org

Contents Copyright © 2021 Predict-Align-Prevent and respective rightsholders. Some rights reserved.